New Jersey has continued to be the most active SREC market both in terms of volume and price action, with the market experiencing a small sell-off in recent days. We maintain that this activity is not necessarily indicative of the true fundamental balance of the market, but rather due to selling pressure from a small group of market participants. In order to provide a more objective perspective on the state of the New Jersey solar market we have updated our capacity presentation, available here.
As of August 31, 2016 there were 1,871.9MW of solar capacity online and generating SRECs in the state of New Jersey. This was up 20.5MW from the New Jersey BPU solar installation report for July 2016, and up 78MW from our last NJ update after the solar installation report for June 2016.
After the June report, we emphasized that the headline number reported in the BPU’s solar installation reports can be slightly misleading if taken solely at face value. A deeper dive into what exactly contributed to the increase from the last report provides additional insight into the true state of the New Jersey market. The 20.5MW increase from the July 2016 report combines the following:
- 1.5MW increase for upward revisions in 2011-2014 monthly figures
- 1.6MW increase for upward revisions in 2015 monthly figures
- 11.3MW increase for upward revisions in 2016 monthly figure for January-June
- 5.5MW increase for upward revisions in July 2016, bringing the monthly build from 7MW to 12.5MW
- 10.9MW addition for new build in August 2016
- 10.2MW decrease for downward revisions in “estimated installations” (essentially the BPU pipeline figure for old PTO applications that have not yet been processed)
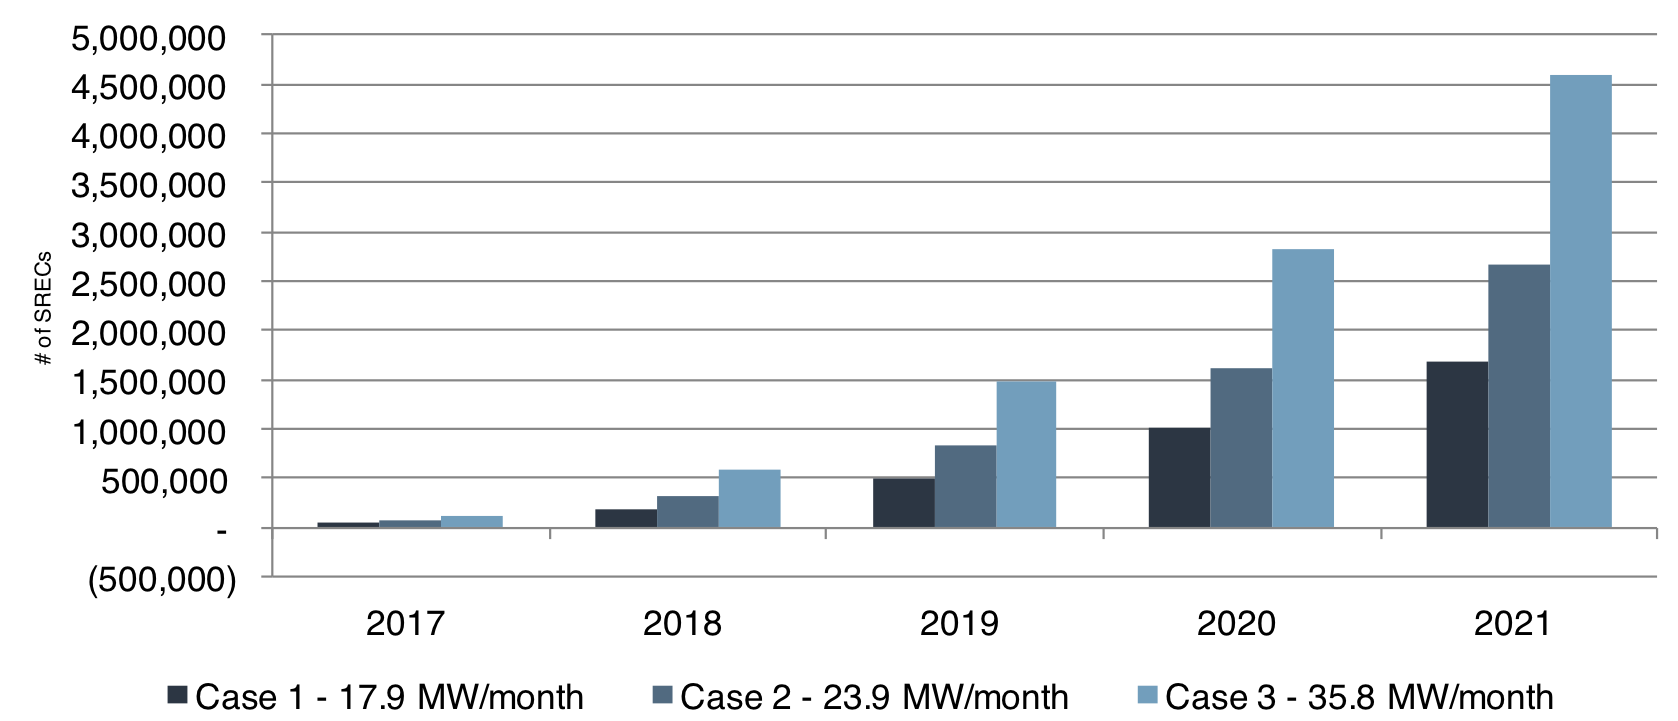
This breakdown helps illustrate a few important trends. First, the magnitude of these revisions has decreased sharply from previous reports, indicating that the BPU may have begun to catch up on the back-dated PTO applications that have served to inflate the headline month-on-month change in reported capacity since Applied Energy Group took over reporting in May of this year. Second, the rate at which new capacity is being built and brought online has slowed markedly since the peak we witnessed in the first half of this year. The average build rate for December 2015 through May 2016 was an impressive 33MW/month, however we believe the current last twelve month (LTM) average of 23.9MW/month is a closer representation of the sustainable long term trend. That LTM is what we use as the base case (Case 2 below) for our resulting scenario analysis and future projections.
In the graph below you’ll find the representation of our projection analysis. Under the current RPS schedule and using the observed LTM build rate as our base case (i.e. Case 2), we see 2017 as slightly over supplied. The market balance continues into a slight oversupply in 2018, with the degree of oversupply steadily increasing year-on-year through 2021. All data and projections are available in our presentation hyperlinked above.
As always, we will continue to monitor the development of the market trends mentioned above and share our analysis as new information becomes available. In the meantime please feel free to reach out to your SRECTrade coverage with any questions or comments.
Disclaimer. This document, data, and/or any of its components (collectively, the “Materials”) are for informational purposes only. The Materials are not intended as investment, tax, legal, or financial advice, or as an offer or solicitation for the purpose or sale of any financial instrument. SRECTrade, Inc. does not warranty or guarantee the market data or other information included herein, as to its completeness, accuracy, or fitness for a particular purpose, express or implied, and such market data and information are subject to change without notice. Past performance should not be taken as an indication or guarantee of future performance, and no representation or warranty, express or implied, is made regarding future performance. Any comments or statements made herein do not necessarily reflect those of SRECTrade, Inc. SRECTrade, Inc. may have issued, and may in the future issue, other communications, data, or reports that are inconsistent with, and reach different conclusions from, the information presented herein.
Copyright. This document is protected by copyright laws and contains material proprietary to SRECTrade, Inc. This document, data, and/or any of its components (collectively, the “Materials”) may not be reproduced, republished, distributed, transmitted, displayed, broadcasted or otherwise disseminated or exploited in any manner without the express prior written permission of SRECTrade, Inc. The receipt or possession of the Materials does not convey any rights to reproduce, disclose, or distribute its contents, or to manufacture, use, or sell anything that it may describe, in whole or in part. If consent to use the Materials is granted, reference and sourcing must be attributed to the Materials and to SRECTrade, Inc. If you have questions about the use or reproduction of the Materials, please contact SRECTrade, Inc.
