Posts Tagged ‘MD SREC’

MD Solar Thermal Systems Await Application from MD PSC

Posted October 25th, 2011 by SRECTrade.

On January 1st, 2012 the Maryland Public Service Commission (PSC) will begin accepting applications for MD-sited Solar Water Heating Systems (SWH) to become certified to sell SRECs in the MD SREC market. As this law allows eligible systems to be installed on or after June 1, 2011, many MD customers are anxiously awaiting their turn to participate in the MD SREC market. As long as a SWH facility meets the necessary metering standards described in an earlier blog post, the facility can produce SRECs for each MWh-equivalent of thermal energy consumed. For single-dwelling residential systems, there is a maximum 5 SRECs per year that may be produced.

The MD PSC will release the formal application form and list of necessary requirements over the next few weeks. While the MD PSC finalizes their application process, MD SWH systems are encouraged to check out our EasyREC SREC management service and to fill out the SRECTrade Solar Thermal EasyREC form. SRECTrade will guide your system through the registration phase and alert you to any supporting documentation that we will need. Check back on our blog for further updates as we approach the new year.

Solar Capacity in the SREC States – February 2011

Posted March 2nd, 2011 by SRECTrade.

SRECTrade SREC Markets Report: February 2011

The following post outlines the megawatts of solar capacity certified and/or registered to create SRECs in the SREC markets SRECTrade currently serves.

Blog Table Image JPG more pixels

PJM Eligible Systems

As of the end of February, there were 12,995 solar PV (12,747) and solar thermal (248) systems registered and eligible to create SRECs in the PJM Generation Attribute Tracking System registry. Of these eligible systems, 43 (0.33%) have a nameplate capacity of 1 megawatt or greater, of which only 3 systems are greater than 5 MW. The largest system, currently located in Ohio, is 12 MW,  and the second largest, located in Chicago and eligible for the PA, DC, and MD markets, is 10 MW. The third largest system, located in NJ, is 5.6 MW.

Massachusetts DOER Qualified Projects

As of February 18, 2011, there were 220 MA DOER qualified solar projects; 204 operational and 16 not operational. Of these qualified systems, 10 (4.5%) have a nameplate capacity of 1 megawatt or greater, of which only 3 are between 1.5 and 2 MW. Only one of the projects greater than 1 MW is currently operational.

Capacity Summary By State

The tables above demonstrate the capacity breakout by state. Note, that for all PJM GATS registered projects, each state includes all projects certified to sell into that state. State RPS programs that allow for systems sited in other states to participate have been broken up by systems sited in state and out of state. Additional detail has been provided to demonstrate the total capacity of systems only certified for one specific state market versus being certified for multiple state markets. For example, PA includes projects only certified to sell into the PA SREC market, broken out by in state and out of state systems, as well as projects that are also certified to sell into PA and Other State markets broken out by in state and out of state systems (i.e. OH, DC, MD, DE, NJ). PA Out of State includes systems sited in states with their own state SREC market (i.e. DE) as well as systems sited in states that have no SREC market (i.e. VA). Also, it is important to note that the Current Capacity represents the total megawatts eligible to produce and sell SRECs as of the noted date, while the Estimated Required Capacity – Current and Next Reporting Year represents the estimated number of MW that need to be online on average throughout the reporting period to meet the RPS requirement within each state. For example, New Jersey needs approximately 255 MW online for the entire 2011 reporting year to meet the RPS requirement. Additionally, the data presented above does not include projects that are in the pipeline or currently going through the registration process in each state program. This data represents specifically the projects that have been approved for the corresponding state SREC markets as of the date noted.

Subscribe


Solar Capacity in the SREC States – January 2011

Posted February 2nd, 2011 by SRECTrade.

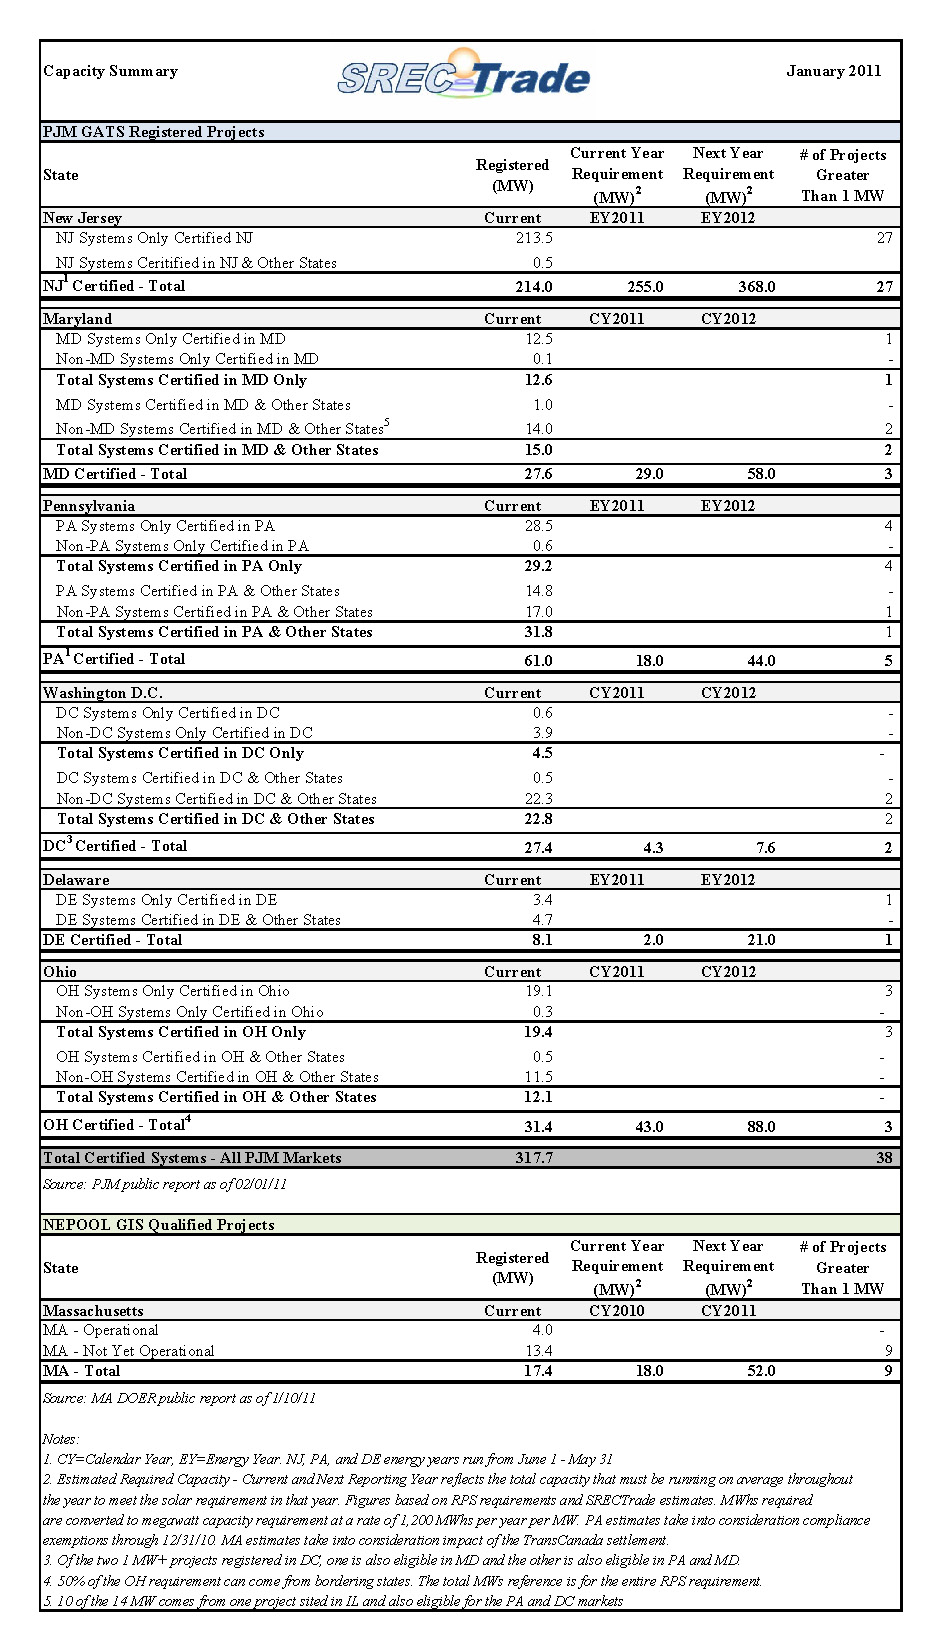
SRECTrade SREC Markets Report: January 2011

The following post outlines the megawatts of solar capacity certified and/or registered to create SRECs in the SREC markets SRECTrade currently serves.

SREC Supply January 2011

PJM Eligible Systems

As of the end of January, there were 12,240 solar PV (12,001) and solar thermal (239) systems registered and eligible to create SRECs in the PJM Generation Attribute Tracking System registry. Of these eligible systems, 38 (0.3%) have a nameplate capacity of 1 megawatt or greater, of which only 3 systems are greater than 5 MW. The largest system, currently located in Ohio, is 12 MW,  and the second largest, located in Chicago and eligible for the PA, DC, and MD markets, is 10 MW. The third largest system, located in NJ, is 5.6 MW.

Massachusetts DOER Qualified Projects

As of January 10, 2011, there were 206 MA DOER qualified solar projects; 183 operational and 23 not operational. Of these qualified systems, 9 (4.4%) have a nameplate capacity of 1 megawatt or greater, of which only 2 are between 1.5 and 2 MW. None of the projects greater than 1 MW are currently operational.

Capacity Summary By State

The tables above demonstrate the capacity breakout by state. Note, that for all PJM GATS registered projects, each state includes all projects certified to sell into that state. State RPS programs that allow for systems sited in other states to participate have been broken up by systems sited in state and out of state. Additional detail has been provided to demonstrate the total capacity of systems only certified for one specific state market versus being certified for multiple state markets. For example, PA includes projects only certified to sell into the PA SREC market, broken out by in state and out of state systems, as well as projects that are also certified to sell into PA and Other State markets broken out by in state and out of state systems (i.e. OH, DC, MD, DE, NJ). PA Out of State includes systems sited in states with their own state SREC market (i.e. DE) as well as systems sited in states that have no SREC market (i.e. VA). Also, it is important to note that the Current Capacity represents the total megawatts eligible to produce and sell SRECs as of the noted date, while the Estimated Required Capacity – Current and Next Reporting Year represents the estimated number of MW that need to be online on average throughout the reporting period to meet the RPS requirement within each state. For example, New Jersey needs approximately 255 MW online for the entire 2011 reporting year to meet the RPS requirement. Additionally, the data presented above does not include projects that are in the pipeline or currently going through the registration process in each state program. This data represents specifically the projects that have been approved for the corresponding state SREC markets as of the date noted.

Subscribe