Archive for March, 2015

SRECTrade Illinois Procurement Program Intro Webinar

Posted March 30th, 2015 by SRECTrade.

SRECTrade will be hosting a webinar on April 7th 2015 at 1:00 PM Central (2:00 PM Eastern) for installers and system owners interested in participating in the upcoming Illinois Supplemental Photovoltaic Procurement Program. The webinar will cover the basic rules of the program, registering a system with SRECTrade, and submitting a bid for the upcoming solicitation.

To register click here

We encourage solar installers active in the state of Illinois to join us to learn how existing and future clients can participate in the Supplemental Photovoltaic Procurement Program. If unable to participate in the webinar, a recording will be made available afterwards.

March 19, 2015 Maryland SREC Market Update Webinar Slides and Recording Available

Posted March 23rd, 2015 by SRECTrade.

On March 19, 2015, SRECTrade hosted a webinar on the MD SREC market. For access to the slides please click here: SRECTrade 03/19/15 MD SREC Update. For access to a video recording of the webinar, click the image below.

This document and recording is protected by copyright laws and contains material proprietary to SRECTrade, Inc. It or any components may not be reproduced, republished, distributed, transmitted, displayed, broadcast or otherwise exploited in any manner without the express prior written permission of SRECTrade, Inc. The receipt or possession of this document does not convey any rights to reproduce, disclose, or distribute its contents, or to manufacture, use, or sell anything that it may describe, in whole or in part. If consent to use these materials is granted, a link to the current version of this document on the SRECTrade website must be included for reference.

SRECTrade Markets Report: February 2015

Posted March 23rd, 2015 by SRECTrade.

The following post is a monthly update outlining the megawatts of solar capacity certified to create SRECs in the Solar REC markets that SRECTrade serves. All PJM data is based on the information available in PJM GATS as of the date noted. All MA data is based on the information provided by the DOER as of the date noted. This analysis does not include projects that are not yet registered and certified with the entities noted herein.

A PDF copy of this table can be found here.

Capacity_February2015

Overview of PJM Eligible Systems Through 3/4/2015

There are 56,894 facilities registered in GATS as of 3/4/2015. See below for a more detailed breakdown.

Screenshot_032215_093306_PM

There are 310 projects over 1 MW in capacity, representing 936.8 MW or 43.9% of the qualified capacity. The largest projects in PJM are concentrated in NJ and MD. There are 47 projects that are 5 MW or larger. These make up 20.6% of all qualified capacity in PJM. The top 5 largest projects are listed below.

NJ Office of Clean Energy Estimated Installed Capacity Through 2/28/15

On March 10, 2015, the New Jersey Office of Clean Energy (OCE) announced total installed solar capacity reached 1,456.6 MW through 2/28/15; an increase of approximately 17.8 MW over the total capacity reported through the end of January 2015. The average last six month build rate per month, according to the OCE data, is 18.7 MW. Note that this data does not directly tie to GATS registration data because of a lag between NJ Office of Clean Energy certifications and GATS registrations.

Overview of MA DOER SREC-I and SREC-II Eligible Systems

SREC-I Program

The Massachusetts SREC-I program was capped on June 30, 2014. As of 3/13/2015 the DOER reported that 25 MW of solar is still listed as Qualified but not operational. In total, 654.8 MW of capacity is listed as qualified, of which 629.8 MW is operational.

SREC-II Program

The SREC-II program opened on April 25, 2014. The program is broken in to Market Sectors. For a detailed overview of the regulations regarding SREC-II please visit here. As of 3/12/2015, 214.9 MW of capacity is currently qualified under the SREC-II program, but only 92.7 MW is operational.

How to Interpret The Capacity Table at the Top of this Post

The tables above demonstrate the capacity breakout by state. Note, that for all PJM GATS registered projects, each state includes all projects certified to sell into that state. State RPS programs that allow for systems sited in other states to participate have been broken up by systems sited in-state and out-of-state. Additional detail has been provided to demonstrate the total capacity of systems only certified for one specific state market versus being certified for multiple state markets. For example, PA includes projects only certified to sell into the PA SREC market, broken out by in-state and out-of-state systems, as well as projects that are also certified to sell into PA and Other State markets broken out by in state and out of state systems (i.e. OH, DC, MD, DE, NJ). PA Out-of-State includes systems sited in states with their own state SREC market (i.e. DE) as well as systems sited in states that have no SREC market (i.e. VA). Also, it is important to note that the Current Capacity represents the total megawatts eligible to produce and sell SRECs as of the noted date, while the Estimated Required Capacity – Current and Next Reporting Year represents the estimated number of MW that need to be online on average throughout the reporting period to meet the RPS requirement within each state with only that particular compliance period vintage. For example, New Jersey needed approximately 496.7 MW online for the entire 2013 reporting year to meet the RPS requirement with 2013 vintage SRECs only. SRECs still available from prior eligible periods can also impact the Solar RPS requirements. Additionally, the data presented above does not include projects that are in the pipeline or currently going through the registration process in each state program. This data represents specifically the projects that have been approved for the corresponding state SREC markets as of the dates noted.

Note: SREC requirements for markets without fixed SREC targets have been forecast based on EIA Report “Retail Sales of Electricity by State by Provider” updated 11/8/13. Projected SRECs required utilizes the most recent EIA electricity data applying an average 1.5% growth rate per forecast year. The state’s RPS Solar requirement is then multiplied by forecast total electricity sales to arrive at projected SRECs required. Projected capacity required is based on a factor of 1,200 MWh in PJM states and 1,160 MWh in MA, generated per MW of installed capacity per year.

MA Solar Development Slow Down Likely as Net Metering Caps are Hit

Posted March 22nd, 2015 by SRECTrade.

This blog post is based on the post available at www.solarisworking.org.

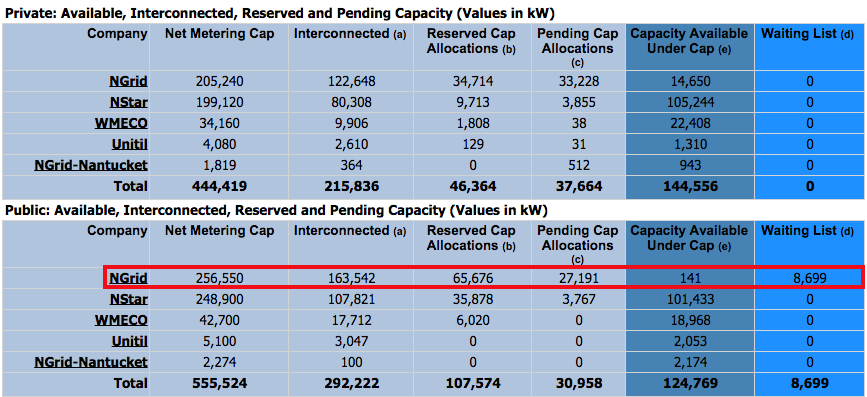
In mid-March 2015, the net metering cap for public projects was hit in the National Grid territory (see red box in chart below). The Commonwealth’s legislatively-mandated net metering caps are based on each utility’s historical peak megawatt energy demand. Effective November 4, 2014  net metering caps were set at 4% for “private” projects and 5% for “public” projects of each utility’s historical peak demand, out of line with the state’s 1600 MW solar target. Representing 45% of total net metering capacity in Massachusetts, National Grid also services a region of Massachusetts where it is easier and less expensive for developers to find suitable sites for solar, but Unitil and NGrid-Nantucket are not far behind in hitting the caps in either the private or public sector. The outlier is the NStar (now EverSource) territory, where it is more difficult and more expensive to find suitable sites for solar.

As the caps across the state’s utilities are hit, new solar projects will no longer be eligible to earn retail credit for the excess power returned to the grid. Instead, they will be credited for any excess power at roughly a third of the retail rate. This decreased benefit would render many solar projects financially unviable. Although residential systems 10 kW or less and many commercial systems 25 kW or less are exempt from net metering caps, community shared solar and larger solar projects are not. As a result, development activity for these projects is expected to come to a halt unless the legislature raises the caps. Several bills have been filed this year to address the need to raise net metering caps in order to meet the Commonwealth’s 1600 MW solar target, and the future of the Commonwealth’s solar industry hangs in the balance as the Legislature reviews the bills on its table.

03202015 caps

Source: Massachusetts System of Assurance of Net Metering Eligibility. The data provided below reflects the best available estimate at the time of access of capacity (kW) interconnected, reserved, and pending that is receiving, or eligible to receive, net metering services. The accuracy of this data set is limited as adjustments to outstanding Applications for Cap Allocation may occur at any time. Data and aggregate figures included in this report should be used for informative purposes only. Verified updates provided in the Application Activity and Remaining Capacity Report will continue to be available on a weekly basis, each Wednesday. Posted 3/20/2014.


If you want to voice your support to raise the net metering caps, here’s what you can do:

  • Tell Governor Baker to support solar in Massachusetts.
  • E-mail or call your state legislators and ask them to raise net metering caps and to support the continuation of the successful SREC program in Massachusetts.
  • Find out who your elected officials are here.
  • Look up and track legislation here.


Visit The Official Website of the Executive Office of Energy and Environmental Affairs to learn more about net metering.


MassSolar Launches “Solar Is Working” Website

Posted March 13th, 2015 by SRECTrade.

On Monday, March 9th, MassSolar proudly announced the launch of their new website, www.SolarIsWorking.org. MassSolar is a collaboration of Massachusetts solar business, solar owners, environmental advocates, community organizations, and motivated citizens dedicated to advancing progressive solar policy Massachusetts. As a versatile resource hub catering to the diverse solar community, MassSolar seeks to achieve modernization and maximization of efforts in the Massachusetts solar sphere while specifically focusing on expansion of the state’s solar economy.

The intuitive site provides its users with a variety of resources useful for installers, residential PV system owners, legislators, and the curious alike.  In addition to market reports and factsheets, the site offers a blog that will host contributions from stakeholders across the Commonwealth’s solar community.  MassSolar intends for the site to serve as a platform for discussions surrounding a home’s solar potential, the Net Metering and Solar Task Force proceedings, as well as legislation impacting the state’s solar industry.

MassSolar’s website also provides fun, yet informative, segments for the less solar savvy such as “10 Things About Solar Energy” and “Solar Stories,” a compilation of anecdotal evidence that highlights the advantages of solar programs in Massachusetts and the efficacy of current statewide programs.  To share your solar story, please send it to info@solarisworking.org.

Maryland Market Update Webinar – March 19th at 2 pm ET

Posted March 12th, 2015 by SRECTrade.

SRECTrade will host a webinar on Thursday, March 19th at 2PM ET to review the Maryland SREC Market.

With a new administration and proposed changes to the RPS, we will examine recent developments in the market. We will review the installed capacity and SREC supply as well as discuss pricing in spot and forward markets.

Please register for the presentation here.