The following post is a monthly update outlining the megawatts of solar capacity certified to create SRECs in the PJM GATS solar REC markets that SRECTrade serves. All data is based on the information available in PJM GATS as of January 17, 2018.
Notes: Due to the convergence of SREC prices across the DE, MD, OH, and PA SREC markets, methodology for calculating PJM GATS Registered MW figures was updated to represent cross-registration between similarly-priced markets. Please see the additional notes below for more information.
Due to the recent passage of Act No. 40 (see HB118) in Pennsylvania, the PA SREC market borders were closed to all future applications from out-of-state facilities. The PA Public Utilities Commission (PUC) will be determining whether or not to grandfather and protect certain out-of-state facilities already certified under the AEPS. At present, it is unclear what the outcome or timeline of this decision will be. Given the nuances of the law, it is possible that facilities that have existing SREC contracts in place will be allowed to maintain their PA SREC eligibility. This decision will naturally have a large impact on certified capacity in the PA SREC market; as a result, this monthly post considers both decision scenarios in the chart below. Please note that SRECTrade is uncertain of the final capacity that will be PA SREC eligible; the figures below represent all capacity available and all in-state capacity available today. Additionally, eligible SRECs issued in previous compliance periods will have an impact on available supply.
Please note that Ohio’s and Pennsylvania’s “PJM GATS Registered MW” figures actually decreased from last month’s Registered Capacity Update. These decreases are due to the de-certification of one multi-MW facility that was cross-certified in DE, OH, and PA. Since this facility’s capacity was larger than the increases in all other capacity during the last month, there were net certified-capacity decreases in these states. Naturally, this facility’s de-certification also impacted capacity growth in Delaware, although not enough to create negative growth.
Please also note the atypically large increase in Maryland’s “PJM GATS Registered MW” from last month (+97.2MW). This large increase is primarily due to one very large multi-MW facility obtaining certification in the MD market.

The chart above compares the megawatts (MWs) registered in PJM GATS as of the date noted (the blue bar) to the estimated RPS solar MWs needed to be operational through the duration of the current reporting year (the green bar) to meet each market’s RPS targets. The Estimated RPS MW figure can be interpreted as the amount of active capacity that would need to be online throughout the year in order to produce the obligatory megawatt hours of electricity mandated by each state’s RPS schedule.
This chart is not meant to be a final representation of SREC supply for a given compliance period, but is instead a visualization of the relationship between installed capacity relative to each state’s estimated RPS requirements converted from a MWh to MW basis. Note that the Registered MW figures do not consider eligible SRECs carried over from previous reporting years and are only used as one aspect of current market supply drawn from the current MWs registered in PJM GATS. The installed capacity operational over the indicated time period will produce SRECs which, in addition to any eligible unsold SRECs from previous periods, will make up the final supply present in the market. For estimates on required number of SRECs per reporting year across the SREC markets SRECTrade covers, please visit our state market summary pages.
As of December 31, 2017, New Jersey had installed a cumulative total of 2,356.5MW of nameplate capacity. Their Solar Installation Report and Solar Pipeline Report can be found online here on the New Jersey Office of Clean Energy website.
Additionally, please note the following in the figures presented above:
OH2017: Represents all OH eligible solar facilities and includes some facilities that are cross-registered in PA. If any systems were eligible in higher priced markets, such as DC, the capacity was excluded from OH eligibility as it could be sold at a higher price in DC.
DE2017: Represents all solar facilities eligible for the DE solar RPS requirement and includes some facilities that are cross-registered in PA.
DC2017: Includes all systems eligible for the DC SREC market. If a system was eligible in another market, it was not included there given the current pricing for DC SRECs.
PA2018: Represents all solar facilities eligible for the PA SREC market. Some systems are cross-registered in DE, MD, and OH as well. If a system was eligible in any higher priced markets (i.e. NJ sited systems that cross-registered in PA) they were not included in the total MW balance displayed above. Please note the additional figures for PA In-State systems.
MD2017: Includes all MD eligible solar capacity registered in PJM GATS and includes some facilities that are cross-registered in PA. If projects were cross-registered in Washington D.C., the capacity was not allocated to Maryland’s eligible MW total.
NJ2018: The balance noted above represents the December 31, 2017 Solar Installation Report reported by Applied Energy Group.
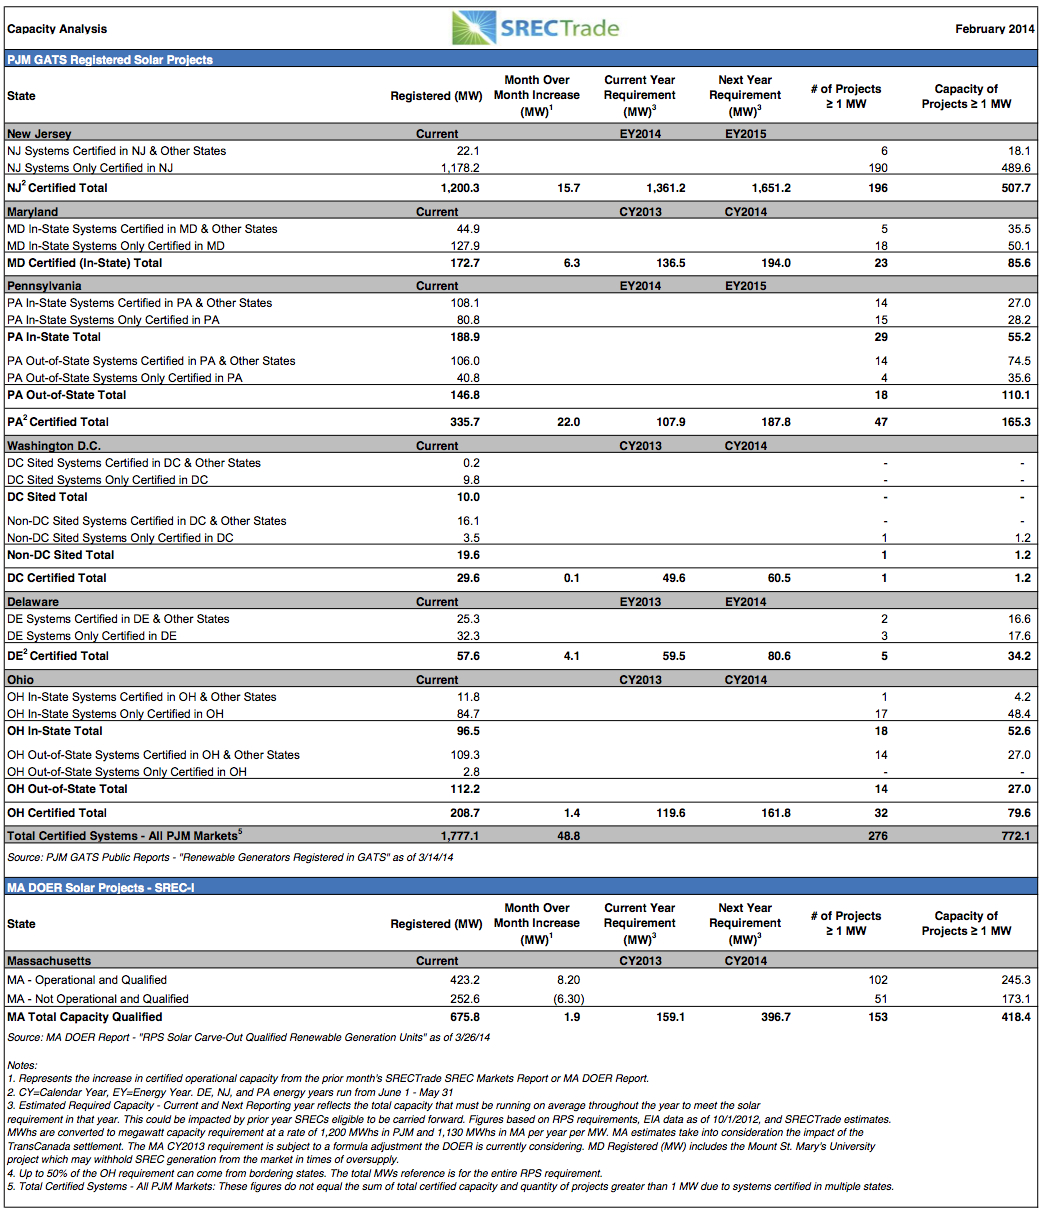
PJM GATS Registered Solar Projects Summary
There are 166,364 facilities across 5,866.3MW registered in PJM GATS as of January 17, 2018.
590 projects are 1MW or larger in capacity, representing 3,194.7MW or 54.5% of the qualified capacity. There are 142 projects that are 5MW or larger, representing 1,955.6MW or 33.3% of all qualified capacity.
Note: SREC requirements for markets without fixed SREC targets have been forecast based on the EIA Report “Retail Sales of Electricity by State by Provider”. Projected SRECs required utilizes the most recent EIA electricity data applying an average 1.0% growth rate per forecast year. The state’s RPS Solar requirement is then multiplied by forecast total electricity sales to arrive at projected SRECs required. Projected capacity required is based on a factor of 1,200MWh, in PJM GATS states, generated per MW of installed capacity per year.
Disclaimer. This document, data, and/or any of its components (collectively, the “Materials”) are for informational purposes only. The Materials are not intended as investment, tax, legal, or financial advice, or as an offer or solicitation for the purpose or sale of any financial instrument. SRECTrade, Inc. does not warranty or guarantee the market data or other information included herein, as to its completeness, accuracy, or fitness for a particular purpose, express or implied, and such market data and information are subject to change without notice. Past performance should not be taken as an indication or guarantee of future performance, and no representation or warranty, express or implied, is made regarding future performance. Any comments or statements made herein do not necessarily reflect those of SRECTrade, Inc. SRECTrade, Inc. may have issued, and may in the future issue, other communications, data, or reports that are inconsistent with, and reach different conclusions from, the information presented herein.
Copyright. This document is protected by copyright laws and contains material proprietary to SRECTrade, Inc. This document, data, and/or any of its components (collectively, the “Materials”) may not be reproduced, republished, distributed, transmitted, displayed, broadcasted or otherwise disseminated or exploited in any manner without the express prior written permission of SRECTrade, Inc. The receipt or possession of the Materials does not convey any rights to reproduce, disclose, or distribute its contents, or to manufacture, use, or sell anything that it may describe, in whole or in part. If consent to use the Materials is granted, reference and sourcing must be attributed to the Materials and to SRECTrade, Inc. If you have questions about the use or reproduction of the Materials, please contact SRECTrade, Inc.