Massachusetts SREC-II Update: January 2016

Posted January 19th, 2016 by SRECTrade.

Last Friday, SRECs generated in Q3 of 2015 were issued to all qualified asset owners in the Massachusetts SREC-I and SREC-II programs. The additional liquidity brought to the market helped refocus attention on the MA SREC program after the beginning of the year was dominated by action in the New Jersey market. Given the renewed attention to the Massachusetts markets we have adjusted our capacity models to reflect the most current supply and demand figures.

Our most recent MA SREC-II capacity presentation can be found here.

As compared to our last MA Capacity Update, the Trailing Six Month (TSM) average build rate is only marginally higher at 18.7 MW/mo as compared to the Trailing Twelve Month (TTM) 17.8 MW/mo. The greatest contrast is between the three months ending in September 2015 and December 2015, with asset developers installing twice as much SREC-II eligible capacity over the summer as what was installed in the fall.

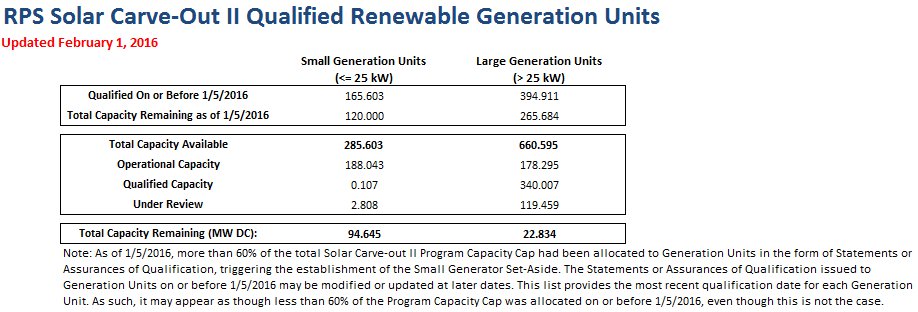
Using these updated numbers we can begin to predict the degree of over or under supply in the upcoming year. Due to the methodology employed by the MA DOER we already know what the 2016 compliance requirement will be.  We can also use the most recent year to date build (YTD) rate, 17.9 MW/month, as our base-case assumption for future 2016 build. What is important to add to this analysis, however, is the 120 MW carve out that the MA DOER announced in their most recent bulletin. Of the total 946.2 MW of SREC-II eligible capacity (1,600 MW of total covered capacity less the 658.3MW covered by SREC-I) we know that 575.1 MW have already been qualified for SREC-II. This leaves 371.1MW still available for new construction, however we now know that since we have passed the 60% threshold of total SREC eligible capacity, 120MW of that remainder will be reserved for projects less than 25KW. This leaves just 251.1MW for larger scale projects under the current program.

Holding our most recent YTD build rate (17.9 MW/mo) constant and using the previously set 2016 compliance obligation, we see the MA SREC-II market finishing 2015 oversupplied by 78,957 SRECs and 2016 oversupplied by 226,537. These figures are equivalent to 64.4% and 69.2% oversupplied, respectively. Slide 8 of our MA SREC-II presentation also illustrates potential upper and lower bounds for 2016 build rates, set at 75% and 150% of 2015 YTD average monthly build. Across all scenarios we project that the market will finish 2016 oversupplied, somewhere between a range of 56.7% to 81.7%

As always, this analysis is informational only in purpose in order to help explain the implications of recently reported MA SREC-II eligible build rates. We will continue to watch the markets closely and stay on top of new MA capacity data as it is updated by the Massachusetts DOER.


Disclaimer. This document, data, and/or any of its components (collectively, the “Materials”) are for informational purposes only. The Materials are not intended as investment, tax, legal, or financial advice, or as an offer or solicitation for the purpose or sale of any financial instrument. SRECTrade, Inc. does not warranty or guarantee the market data or other information included herein, as to its completeness, accuracy, or fitness for a particular purpose, express or implied, and such market data and information are subject to change without notice. Past performance should not be taken as an indication or guarantee of future performance, and no representation or warranty, express or implied, is made regarding future performance. Any comments or statements made herein do not necessarily reflect those of SRECTrade, Inc. SRECTrade, Inc. may have issued, and may in the future issue, other communications, data, or reports that are inconsistent with, and reach different conclusions from, the information presented herein.

Copyright. This document is protected by copyright laws and contains material proprietary toSRECTrade, Inc. This document, data, and/or any of its components (collectively, the “Materials”) may not be reproduced, republished, distributed, transmitted, displayed, broadcasted or otherwise disseminated or exploited in any manner without the express prior written permission ofSRECTrade, Inc. The receipt or possession of the Materials does not convey any rights to reproduce, disclose, or distribute its contents, or to manufacture, use, or sell anything that it may describe, in whole or in part. If consent to use the Materials is granted, reference and sourcing must be attributed to the Materials and to SRECTrade, Inc. If you have questions about the use or reproduction of the Materials, please contact SRECTrade, Inc.


MA DOER Announces Solar Carve-Out II Small Generator Set-Aside

Posted January 12th, 2016 by SRECTrade.

Nearly two years after its launch in April 2014, the MA Solar Carve Out-II (SREC-II) program is steadily approaching the 1600 MW capacity cap. As successor to the SREC-I program, the SREC-II program has provided market-based incentives to support solar photovoltaic (PV) development in the Commonwealth of Massachusetts. The SREC-II program was designed to support 946.2 MW of installed capacity (1600 MW less the final 653.8 MW capacity installed under the SREC-I program). The Massachusetts Department of Energy Resources (DOER) included provisions in the SREC-II program to establish set-asides for Small Generation Units when sixty percent of the program’s capacity had been allocated. As of January 4, 2016, the DOER has qualified or approved 575.1 MW (over sixty percent) of SREC-II’s capacity, leading them to revise the Assurance of Qualification Guideline and formally announce a 120 MW set-aside for systems with nameplate capacities of 25 kW or less.

With more than 575 MW of qualified capacity to date, there is roughly 370 MW left until the program reaches capacity. The 120 MW set-aside for Small Generation Units leaves approximately 250 MW for all other systems to be qualified under SREC-II. The DOER announced that, once it issues Assurances of Qualifications and Statements of Qualification (SQA) for a combined 1,480 MW of capacity under the SREC-I and SREC-II programs, all applications for projects larger than 25 kW will be queued on a waiting list for available program capacity. As a reminder, the waiting list for prospective SREC-II systems is prioritized by the date on which the complete and correct SQA was submitted. Applications submitted on the same day are then prioritized by the execution date of the system’s Interconnection Service Agreement. In the event that two or more complete SQAs are submitted on the same day and with identical Interconnection Service Agreement dates, the DOER will finalize the queue through random selection.

In addition to establishing the Small Generation Unit set-aside, the DOER also clarified in its revised guideline: (1) what constitutes a complete SQA, (2) the procedure for qualified generation units to withdraw their Assurance of Qualification, and (3) the correction process and timeline for applications that are found to be incomplete upon submission.

In light of the program hitting its sixty percent capacity mark, facility owners and managers should be prepared to submit applications as the SREC-II program nears its final capacity. SRECTrade will continue to monitor and report on the status of the SREC-II program and provide information about successive programs. The combined success of the SREC-I and SREC-II programs in supporting distributed solar PV development suggests that the implementation of a third SREC program will further bolster the MA distributed solar industry. Issuing SRECs to solar PV system owners for every megawatt-hour (MWh) of solar energy they generate has helped MA become a national leader in solar.

To view the original notice from the DOER click here.

SRECTrade Illinois Procurement Program Webinar

Posted January 8th, 2016 by SRECTrade.

SRECTrade will be hosting a webinar on January 13, 2016 at 1:00 PM Central (2:00 PM Eastern) for installers and system owners interested in participating in the upcoming Illinois Supplemental Photovoltaic Procurement Program. The webinar will cover the basic rules of the program, registering a system with SRECTrade, and submitting a bid for the upcoming solicitation in March 2016.

To register click here

We encourage solar installers active in the state of Illinois to join us to learn how existing and future clients can participate in the Supplemental Photovoltaic Procurement Program. If unable to participate in the webinar, a recording will be made available afterwards.

DOER and MassCEC Launch New Mass Solar Loan Program

Posted January 5th, 2016 by SRECTrade.

Prior to the close of 2015, the Massachusetts Department of Energy Resources (DOER) and the Massachusetts Clean Energy Center (MassCEC) announced their launch of the Mass Solar Loan program. The program is intended to encourage solar development by offering low-interest loans to residents and property owners. Mass Solar Loan provides access to financing options for homeowners and renters with moderate incomes or low credit scores. The DOER will provide policy and program oversight of the program, and the MassCEC will serve as the program’s Central Administrator. The Mass Solar Loan program is funded by $30 million of alternative compliance payments (ACPs) from the state’s Renewable Energy Credit (REC and SREC) programs. The Mass Solar Loan Program Manual provides a comprehensive description of the program.

The program offers three primary financial incentives for Massachusetts residents to go solar. One of these incentives is a three percent reduction in the standard annual interest rate charged by participating lenders. This “Interest Rate Buy Down” is offered to all solar system owners, regardless of income. Another feature is the “Loan Loss Reserve”, which gives lenders additional motivation to work with system owners who have a low credit score. The third primary incentive is income-based loan support for consumers with annual household incomes at or below $80,240. Qualifying consumers can have the solar loan program pay a percentage of their loan principal upon project completion. Incentive rates are 30% of the loan value for annual household incomes below $66,866 and 20% of the loan value for household incomes between $66,866 and $80,240.

The MassCEC provides information pertinent to consumers and homeowners, solar installers, and banks and credit unions. This information details how all interested parties can apply for participation in the Mass Solar Loan program.

SRECTrade Markets Report: November 2015

Posted December 28th, 2015 by SRECTrade.

The following post is a monthly update outlining the megawatts of solar capacity certified to create SRECs in the Solar REC markets that SRECTrade serves. All PJM data is based on the information available in PJM GATS as of the date noted. All MA data is based on the information provided by the DOER as of the date noted. This analysis does not include projects that are not yet registered and certified with the entities noted herein.

A PDF copy of this table can be found here.

Capacity_November2015

There are 73,084 facilities registered in GATS as of 12/15/2015. See below for a more detailed breakdown.

STH_PV Split

There are 341 projects over 1 MW in capacity, representing 1,122.9 MW or 45.0% of the qualified capacity. The largest projects in PJM are located in NC, MD, NJ and IL. There are 61 projects that are 5 MW or larger. These make up 23.5% of all qualified capacity in PJM. The top 5 largest projects are listed below.

Top 5 Largest


NJ Office of Clean Energy Estimated Installed Capacity Through 11/30/15

On December 18 2015, the New Jersey Office of Clean Energy (OCE) announced total installed solar capacity reached 1,567.2 MW through 11/30/15; an increase of approximately 10.6 MW over the total capacity reported through the end of October 2015. The average last six month build rate per month, according to the OCE data, is 13.5 MW. Note that this data does not directly tie to GATS registration data because of a lag between NJ Office of Clean Energy certifications and GATS registrations.

Overview of MA DOER SREC-I and SREC-II Eligible Systems

SREC-I Program

The Massachusetts SREC-I program was capped on June 30, 2014. As of 10/14/2015 the DOER reported that 6.7 MW of solar is still listed as Qualified but not operational. In total, 653.8 MW of capacity is listed as qualified, of which 647.1 MW is operational.

SREC-II Program

The SREC-II program opened on April 25, 2014. The program is broken in to Market Sectors. For a detailed overview of the regulations regarding SREC-II please visit here. As of 12/23/2015, 545.5 MW of capacity is currently qualified under the SREC-II program, but only 300.6MW is operational.

Starting May 15, 2015 the DOER began publishing data showing generation units under review in the SREC-II Program.  Total capacity under review is 34.2 MW, of which 6.5 MW is operational.

How to Interpret The Capacity Table at the Top of this Post

The tables above demonstrate the capacity breakout by state. Note, that for all PJM GATS registered projects, each state includes all projects certified to sell into that state. State RPS programs that allow for systems sited in other states to participate have been broken up by systems sited in-state and out-of-state. Additional detail has been provided to demonstrate the total capacity of systems only certified for one specific state market versus being certified for multiple state markets. For example, PA includes projects only certified to sell into the PA SREC market, broken out by in-state and out-of-state systems, as well as projects that are also certified to sell into PA and Other State markets broken out by in state and out of state systems (i.e. OH, DC, MD, DE, NJ). PA Out-of-State includes systems sited in states with their own state SREC market (i.e. DE) as well as systems sited in states that have no SREC market (i.e. VA). Also, it is important to note that the Current Capacity represents the total megawatts eligible to produce and sell SRECs as of the noted date, while the Estimated Required Capacity – Current and Next Reporting Year represents the estimated number of MW that need to be online on average throughout the reporting period to meet the RPS requirement within each state with only that particular compliance period vintage. For example, New Jersey needed approximately 496.7 MW online for the entire 2013 reporting year to meet the RPS requirement with 2013 vintage SRECs only. SRECs still available from prior eligible periods can also impact the Solar RPS requirements. Additionally, the data presented above does not include projects that are in the pipeline or currently going through the registration process in each state program. This data represents specifically the projects that have been approved for the corresponding state SREC markets as of the dates noted.

Note: SREC requirements for markets without fixed SREC targets have been forecast based on EIA Report “Retail Sales of Electricity by State by Provider” through 2013. Projected SRECs required utilizes the most recent EIA electricity data applying an average 1.0% growth rate per forecast year. The state’s RPS Solar requirement is then multiplied by forecast total electricity sales to arrive at projected SRECs required. Projected capacity required is based on a factor of 1,200 MWh in PJM states and 1,160 MWh in MA, generated per MW of installed capacity per year.

Congress Passes Extension of Investment Tax Credit (ITC) for Solar

Posted December 18th, 2015 by SRECTrade.

Earlier today, Congress passed the FY 2016 Omnibus Appropriations bill, which includes tax extenders and $1.1 trillion in government funding. The spending package includes a pivotal extension of the federal investment tax credit (ITC) for solar energy. The bill is the result of a bicameral and bipartisan compromise, by which Congressional Democrats pursued the extension of this federal subsidy as partial compensation for lifting the ban on US crude oil exports. At first, Democrats believed that the bill would be a loss for the environment, but Democratic leaders urged their party members to recognize the net benefits of extending support for renewable energy development.

“May the force be with you,” quipped Senator Dianne Feinstein (D-CA), encouraging her fellow Senators to vote in favor of the package just hours after the House passed the bill. The bill passed both chambers of Congress by impressive majorities. The House approved by a 316 to 113 vote, and the Senate approved by a 65 to 33 vote.

While existing law provided the 30% solar ITC through the end of 2016, the extension guarantees 30% through 2019, declining to 26% in 2020 and 22% in 2021. After 2021, the 10% credit for Section 48 (commercial) projects will remain in place, per existing law. However, the bill includes “commence-construction” provisions that allow projects to qualify if they come on-line by the end of 2023. These extensions will help states to meet their Renewable Portfolio Standard and other renewable energy goals by helping project owners offset the cost of investing in renewable energy. The federal ITC, coupled with additional incentives, such as Solar Renewable Energy Credits (SRECs), encourages investment in renewable technologies across the country.

The ITC extension will undoubtedly have a significant impact on the solar industry. Experts project that the extension will increase solar installations by 54 percent (compared to a non-extension scenario) and create a 20 GW annual solar market through 2020. The extension is expected to impact utility-scale solar the most, where installations could increase by as much as 73% through 2020. Comparatively, residential installations are expected to experience a 35% growth, and commercial installations are expected to grow by 51%. This anticipated development will spur economic growth and an anticipated incremental investment of $40 billion in the solar industry.

After proposing an extension of the ITC in his 2016 budget earlier this year, the passage of this bill reinforces President Obama’s inaugural commitment to addressing climate change and protecting the planet for future generations. The bill also follows the historic adoption of the Paris Climate Agreement, which was made at COP21 in Paris earlier this month. Although the Agreement still needs to be adopted by the U.S. Government, the President is resolute that the Agreement will survive Republican opposition and become law. In a statement following COP21, President Obama said that “this moment can be a turning point for the world[,]” and this bill is certainly a step in the right direction for America’s commitment to the new international goal.

Maryland Lawmakers Propose Increase to Renewable Portfolio Standard

Posted December 11th, 2015 by SRECTrade.

Chief policymakers in Maryland gathered on Tuesday, December 8th to publicly unveil their plan to establish the largest clean energy program in the state’s history. The proposed 2016 “Clean Jobs Act” is a $40 million plan to stimulate Maryland’s clean energy sector and to increase the state’s existing Renewable Portfolio Standard (RPS) to 25 percent by 2020, a sizable increase over the state’s current goal of 20 percent by 2022. This would increase the number of Solar Renewable Energy Credits (SRECs) needed to be purchased and retired by state electricity suppliers. Two of the plan’s major proponents, Senate Majority Leader Catherine Pugh (D-Baltimore) and Delegate Dereck Davis (D-Prince George’s), announced the plan during a press conference alongside a diverse base of supporters, including small businesses, community colleges, climate advocates, and job training leaders. Senator Pugh and Delegate Davis are also joined by bipartisan co-sponsorship from Senator Brian Feldman and Delegate Bill Frick of Montgomery County, who initiated legislation to expand Maryland’s RPS earlier this year. As 2015 comes to a close, Delegate Davis asserted that “2016 is the year to pass this ‘Clean Jobs Act’ for Maryland.”

The proposed workforce development plan within the larger RPS bill will source $40 million from unallocated contributions from Maryland’s Strategic Energy Investment Fund. If passed, the Act will create an estimated 2,000 additional clean energy jobs and further contribute to the rapidly-growing Maryland renewable energy sector. The state’s solar industry already supports over 3,000 workers, and the industry is expected to add 750 more jobs this year. Collectively, state policies addressing climate change are projected to generate 26,000 to 33,000 new jobs and increase wages by tens of billions of dollars by 2020.

In addition to addressing the state’s economic needs, the bill helps Maryland to address climate change with clean energy, while improving air quality and reducing greenhouse gas emissions. The RPS increase will create financial incentives to add approximately 1,300 Megawatts (MW) of clean energy by 2020. Decreasing solar and wind prices and the potential for utilizing untapped energy assets will help facilitate the achievement of this goal. The announcement of the plan follows a positive report from the Department of the Environment that Maryland is well on its way to meeting its existing goals, and broad support from faith, labor, social justice and environmental constituencies bolsters public support for the new plan.

“I’m proud to sponsor this legislation because addressing climate change and improving our economy go hand-in-hand,” said Sen. Feldman. “It’s time to lock in Maryland as a leader in both.”

Illinois Supplemental PV Procurement Results – Round 2 November 2015

Posted November 23rd, 2015 by SRECTrade.

In November 2015, SRECTrade participated in the second round of the Illinois 2015 PV Procurement Program. SRECTrade was among the 11 winning suppliers of the 5-year SREC contracts awarded through the procurement program. For the IPA’s official announcement, click HERE.

Screenshot_112015_105847_AM

SRECTrade Markets Report: October 2015

Posted November 20th, 2015 by SRECTrade.

**(UPDATE: Template below updated on 11/25/15 to reflect new MA DOER SREC-II information as of 11/18/15.)

The following post is a monthly update outlining the megawatts of solar capacity certified to create SRECs in the Solar REC markets that SRECTrade serves. All PJM data is based on the information available in PJM GATS as of the date noted. All MA data is based on the information provided by the DOER as of the date noted. This analysis does not include projects that are not yet registered and certified with the entities noted herein.

A PDF copy of this table can be found here.

Capacity_October2015

There are 71,261 facilities registered in GATS as of 11/10/2015. See below for a more detailed breakdown.

PV and STH Oct 2015

There are 335 projects over 1 MW in capacity, representing 1,087.4 MW or 44.5% of the qualified capacity. The largest projects in PJM are located in NC, MD, NJ and IL. There are 56 projects that are 5 MW or larger. These make up 22.7% of all qualified capacity in PJM. The top 5 largest projects are listed below.

2015_11 Q4 15 GTM Report Inserts_11-11-15 5 Largest copy


NJ Office of Clean Energy Estimated Installed Capacity Through 10/31/15

On November 10, 2015, the New Jersey Office of Clean Energy (OCE) announced total installed solar capacity reached 1,556.7MW through 10/31/15; an increase of approximately 10.35 MW over the total capacity reported through the end of September 2015. The average last six month build rate per month, according to the OCE data, is 13 MW. Note that this data does not directly tie to GATS registration data because of a lag between NJ Office of Clean Energy certifications and GATS registrations.

Overview of MA DOER SREC-I and SREC-II Eligible Systems

SREC-I Program

The Massachusetts SREC-I program was capped on June 30, 2014. As of 10/14/2015 the DOER reported that 6.7 MW of solar is still listed as Qualified but not operational. In total, 653.8 MW of capacity is listed as qualified, of which 647.1 MW is operational.

SREC-II Program

The SREC-II program opened on April 25, 2014. The program is broken in to Market Sectors. For a detailed overview of the regulations regarding SREC-II please visit here. As of 11/18/2015, 465.5 MW of capacity is currently qualified under the SREC-II program, but only 275.2MW is operational.

Starting May 15, 2015 the DOER began publishing data showing generation units under review in the SREC-II Program.  Total capacity under review is 21.2 MW, of which 2.9 MW is operational.

How to Interpret The Capacity Table at the Top of this Post

The tables above demonstrate the capacity breakout by state. Note, that for all PJM GATS registered projects, each state includes all projects certified to sell into that state. State RPS programs that allow for systems sited in other states to participate have been broken up by systems sited in-state and out-of-state. Additional detail has been provided to demonstrate the total capacity of systems only certified for one specific state market versus being certified for multiple state markets. For example, PA includes projects only certified to sell into the PA SREC market, broken out by in-state and out-of-state systems, as well as projects that are also certified to sell into PA and Other State markets broken out by in state and out of state systems (i.e. OH, DC, MD, DE, NJ). PA Out-of-State includes systems sited in states with their own state SREC market (i.e. DE) as well as systems sited in states that have no SREC market (i.e. VA). Also, it is important to note that the Current Capacity represents the total megawatts eligible to produce and sell SRECs as of the noted date, while the Estimated Required Capacity – Current and Next Reporting Year represents the estimated number of MW that need to be online on average throughout the reporting period to meet the RPS requirement within each state with only that particular compliance period vintage. For example, New Jersey needed approximately 496.7 MW online for the entire 2013 reporting year to meet the RPS requirement with 2013 vintage SRECs only. SRECs still available from prior eligible periods can also impact the Solar RPS requirements. Additionally, the data presented above does not include projects that are in the pipeline or currently going through the registration process in each state program. This data represents specifically the projects that have been approved for the corresponding state SREC markets as of the dates noted.

Note: SREC requirements for markets without fixed SREC targets have been forecast based on EIA Report “Retail Sales of Electricity by State by Provider” through 2013. Projected SRECs required utilizes the most recent EIA electricity data applying an average 1.0% growth rate per forecast year. The state’s RPS Solar requirement is then multiplied by forecast total electricity sales to arrive at projected SRECs required. Projected capacity required is based on a factor of 1,200 MWh in PJM states and 1,160 MWh in MA, generated per MW of installed capacity per year.

Maryland SREC Update: October 2015

Posted October 28th, 2015 by SRECTrade.

Last week, attention focused on the Maryland SREC market. On Monday, 10/19/15, Maryland regulated utilities awarded load auction bids for electricity supply. Electric load was contracted for anywhere between 3 and 24 months into the future. Once load suppliers begin to lock in their load obligations, attention naturally turns to the REC markets to begin planning for the corresponding compliance obligations.

Given the additional attention on the recent load auction and the consequent trading activity in the MD SREC market, we have refreshed our capacity scenarios to get a stronger sense of the current balance between supply from recently built projects and demand from RPS compliance obligations.

Our most recent MD SREC capacity presentation can be found here.

As of our last MD capacity update, Last Twelve Month (LTM) monthly build rates were 5.8 MW per month. Due to a remaining balance of approximately 73,400 CY 2013 and 2014 SRECs and a strong Q4 2014 build, the market was expected to be slightly oversupplied in the short term (2015 and 2016) by about 10%-30%; depending on forecast monthly solar build rates. Despite this short term oversupply, the market was projected to return to balance by 2017 with significant under supply in 2018 and 2019. At the time, supply/demand balance and observed build rates justified the thesis that the MD solar market had the ability to digest more project build.

Since the late spring / early summer, the PJM GATS renewable generators report shows Maryland experienced a strong uptick in new build during the summer, with build rates from June through August increasing 34% from the previous three months ending in May.

Average LTM build rates now stand at 10.6 MW per month.  At this increased pace, the Maryland SREC market will experience over supply in the coming years. Across three scenarios – 75%, 100%, and 150% of LTM solar build rates – the market is forecast to be oversupplied through 2019.

What this means for MD SREC pricing 

If these observed build rates continue into the future, downward pricing pressure will result as more and more supply is brought to market. This is particularly relevant now, as electricity companies who have sold electric supply for the next 24 months will be looking to buy their SREC exposure for a similar time period.  Market participants can look at forward structures such as multi-year SREC strips as an opportunity to lock in forward pricing to protect from any future price movement.

As always, this analysis is informational only in purpose in order to help explain the emphasis on MD SREC markets last week. We will continue to watch the markets closely and stay on top of new MD capacity data as it is updated by PJM-GATS.


Disclaimer. This document, data, and/or any of its components (collectively, the “Materials”) are for informational purposes only. The Materials are not intended as investment, tax, legal, or financial advice, or as an offer or solicitation for the purpose or sale of any financial instrument. SRECTrade, Inc. does not warranty or guarantee the market data or other information included herein, as to its completeness, accuracy, or fitness for a particular purpose, express or implied, and such market data and information are subject to change without notice. Past performance should not be taken as an indication or guarantee of future performance, and no representation or warranty, express or implied, is made regarding future performance. Any comments or statements made herein do not necessarily reflect those of SRECTrade, Inc. SRECTrade, Inc. may have issued, and may in the future issue, other communications, data, or reports that are inconsistent with, and reach different conclusions from, the information presented herein.

Copyright. This document is protected by copyright laws and contains material proprietary to SRECTrade, Inc. This document, data, and/or any of its components (collectively, the “Materials”) may not be reproduced, republished, distributed, transmitted, displayed, broadcasted or otherwise disseminated or exploited in any manner without the express prior written permission of SRECTrade, Inc. The receipt or possession of the Materials does not convey any rights to reproduce, disclose, or distribute its contents, or to manufacture, use, or sell anything that it may describe, in whole or in part. If consent to use the Materials is granted, reference and sourcing must be attributed to the Materials and to SRECTrade, Inc. If you have questions about the use or reproduction of the Materials, please contact SRECTrade, Inc.