
The following post is a monthly update outlining the megawatts of solar capacity certified to create SRECs in the PJM Solar REC markets SRECTrade serves. All data is based on the information available in PJM GATS as of the date noted.

The chart above represents the megawatts registered in PJM GATS as of February 2, 2016 (the blue bar) vs. the estimated RPS solar MWs needed to be operational all year long, in the current reporting year, to meet each market’s RPS targets (the green bar). Note, the Estimated RPS MWs does not take into consideration SRECs eligible from previous reporting years and is only used as an estimate relative to the current MWs registered in GATS. All actual RPS requirements are represented in megawatt hours (i.e. SRECs) required per year. The installed capacity operational over that time will produce SRECs, in addition to any eligible SRECs from previous periods, to end up with the final supply relative to that reporting year’s demand. For estimates on required number of SRECs per reporting year across the SREC markets SRECTrade covers, please visit our state market summary pages.
The NJ PJM GATS Registered MW shown above is representative of the installed solar capacity as of 12/31/2015 as reported by the NJ Board of Public Utilities and Office of Clean Energy on January 25, 2016. For the full report click here.
Additionally, please note the following in the figures presented above:
OH2016: Represents all OH eligible solar facilities and includes some facilities that are cross registered in PA. If any systems were eligible in higher priced markets, such as DC, the capacity was excluded from OH eligibility as it could be sold at a higher price in DC.
DE2015: Represents all solar facilities eligible for the DE solar RPS requirement. Some facilities registered in DE are also eligible in PA and could impact that market’s supply.
DC2016: Includes all systems eligible for the DC SREC market. If a system was eligible in another market, it was not included there given the current pricing for DC SRECs.
PA2016: Represents all solar facilities eligible for the PA SREC market. Some systems are cross registered in OH as well. If a system was eligible in any higher priced markets (i.e. NJ or MD sited systems that cross registered in PA) they were not included in the total MW balance displayed above.
MD2016: Includes all MD eligible solar capacity registered in GATS as of the date noted. If projects were cross registered in Washington D.C., the capacity was not allocated to Maryland’s eligible MW total.
NJ2016: The balance noted above represents the 12/31/15 MWs installed reported by the NJ BPU on 1/25/2016.
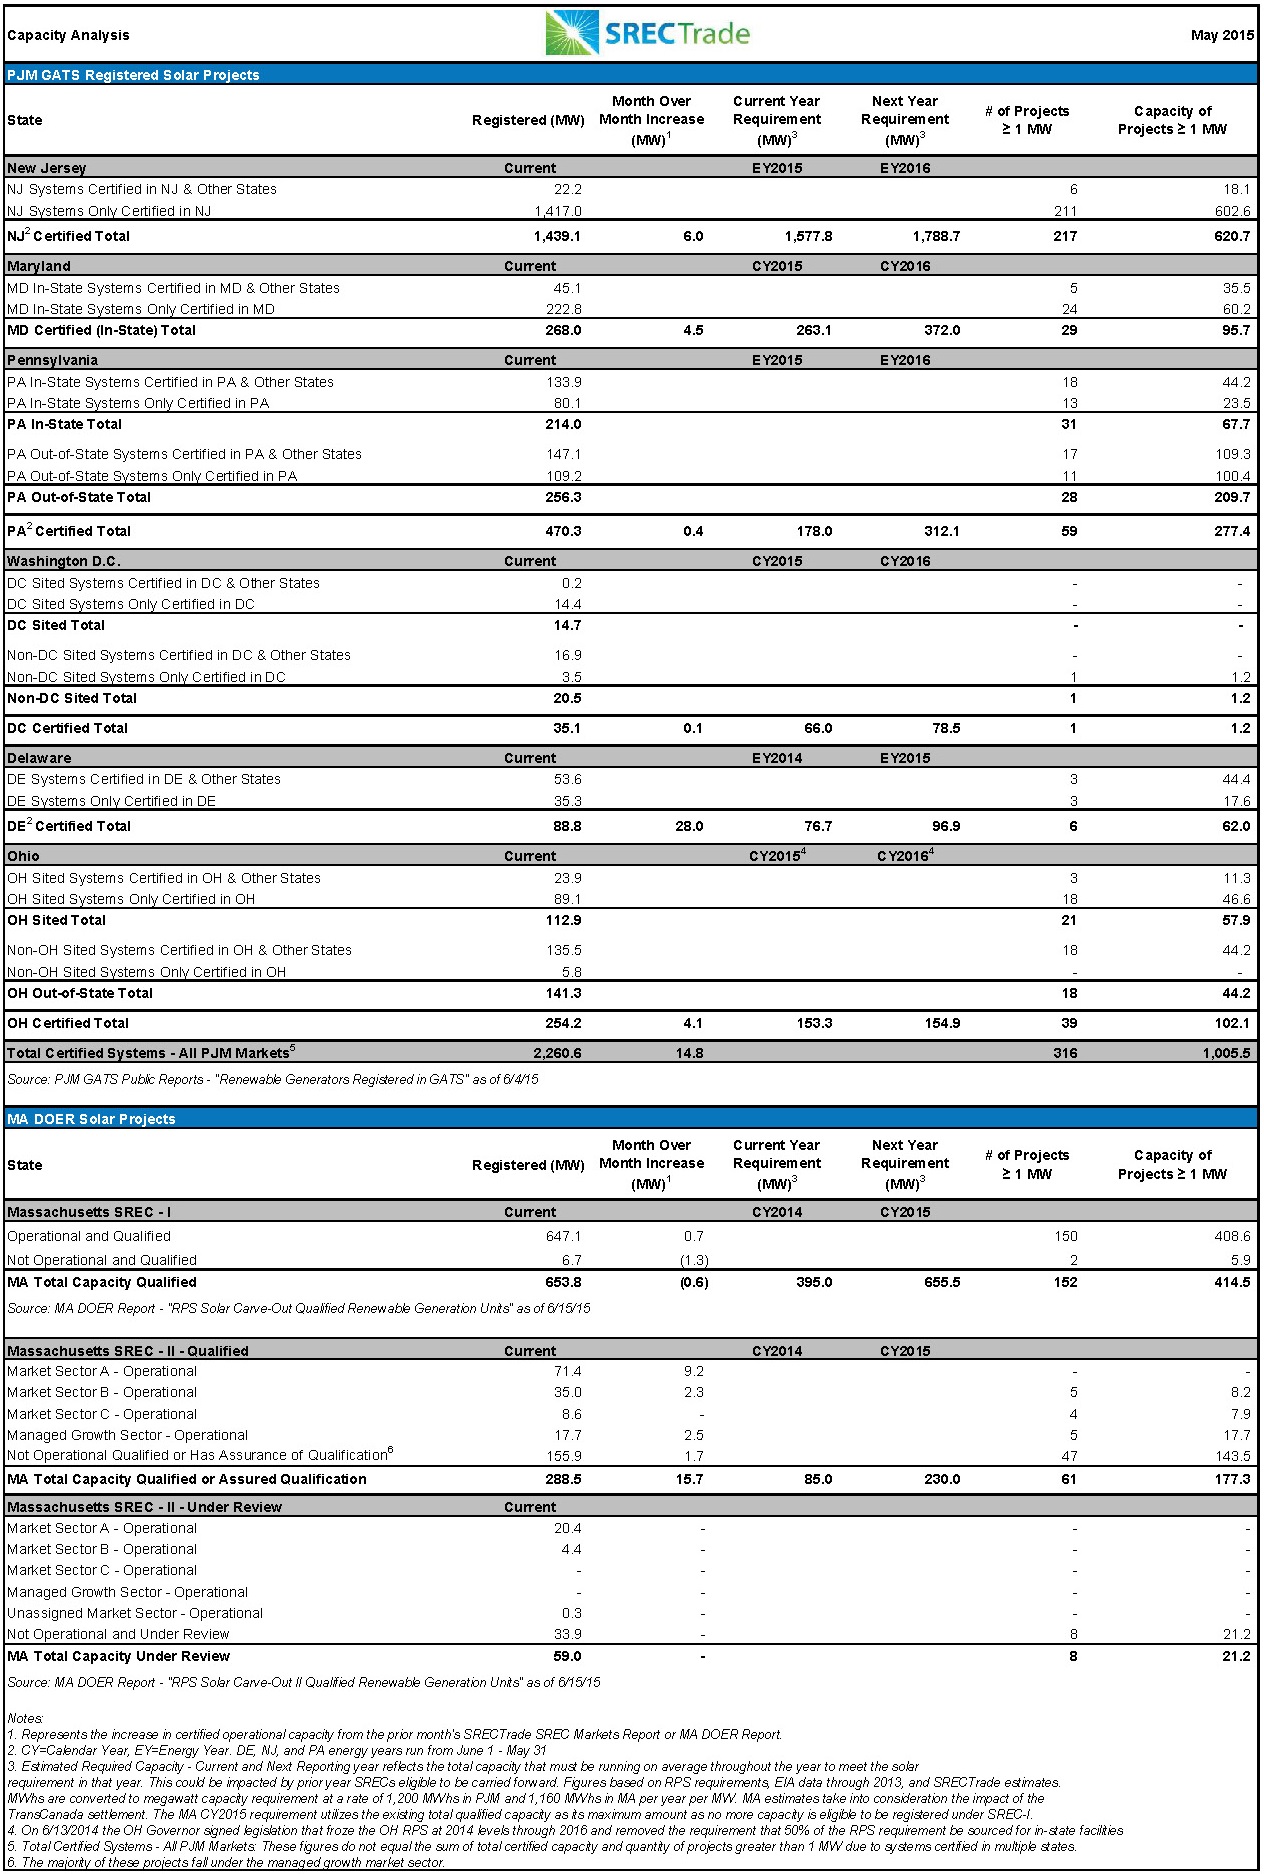
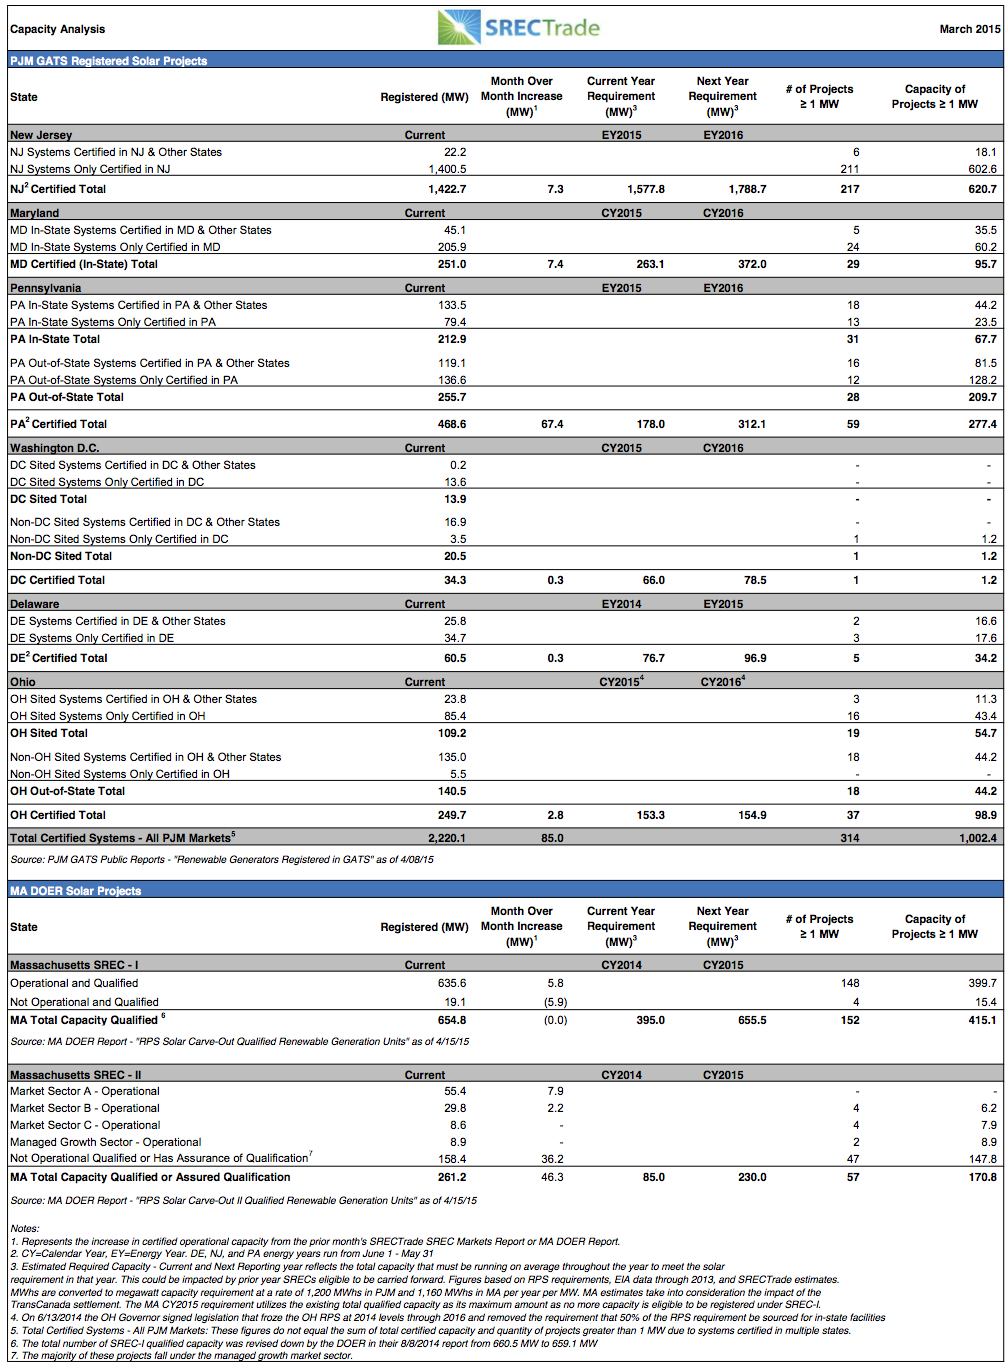
PJM GATS Registered Solar Projects Summary
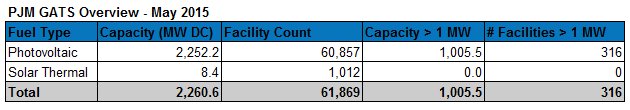
There are 76,572 facilities across 2,553.2 MW registered in GATS as of 2/2/2016.
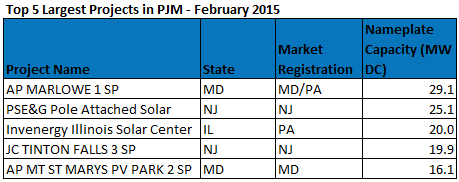
347 projects are 1 MW or larger in capacity, representing 1,136.3 MW or 44.5% of the qualified capacity. There are 66 projects that are 5 MW or larger. These make up 23.7% of all qualified capacity, 604.2 MW total, in PJM.
Note: SREC requirements for markets without fixed SREC targets have been forecast based on EIA Report “Retail Sales of Electricity by State by Provider”. Projected SRECs required utilizes the most recent EIA electricity data applying an average 1.0% growth rate per forecast year. The state’s RPS Solar requirement is then multiplied by forecast total electricity sales to arrive at projected SRECs required. Projected capacity required is based on a factor of 1,200 MWh, in PJM states, generated per MW of installed capacity per year.
Tweet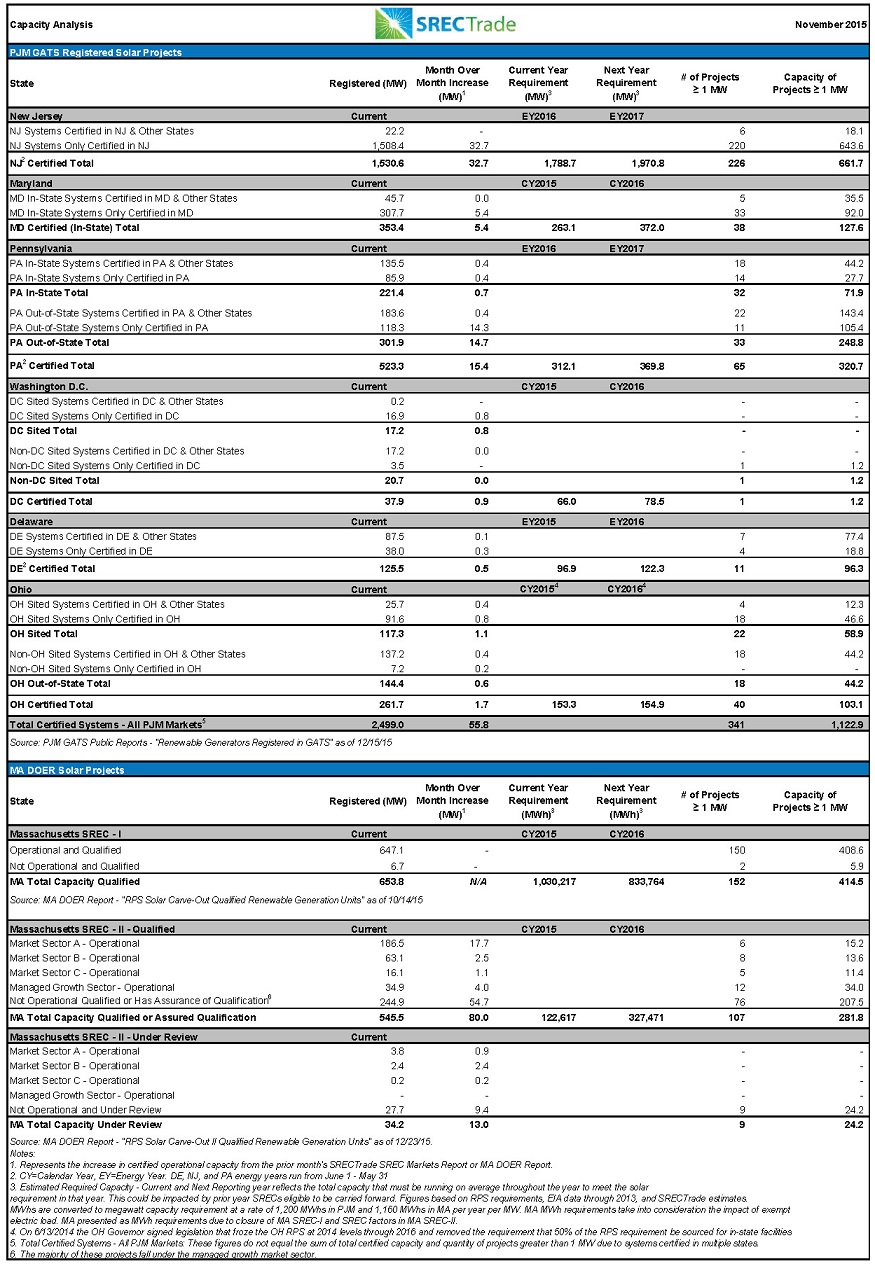


