Archive for the ‘Capacity Summary’ Category

SRECTrade Markets Report: January 2015

Posted February 20th, 2015 by SRECTrade.

The following post is a monthly update outlining the megawatts of solar capacity certified to create SRECs in the Solar REC markets that SRECTrade serves. All PJM data is based on the information available in PJM GATS as of the date noted. All MA data is based on the information provided by the DOER as of the date noted. This analysis does not include projects that are not yet registered and certified with the entities noted herein.

A PDF copy of this table can be found here.

Capacity_January2015

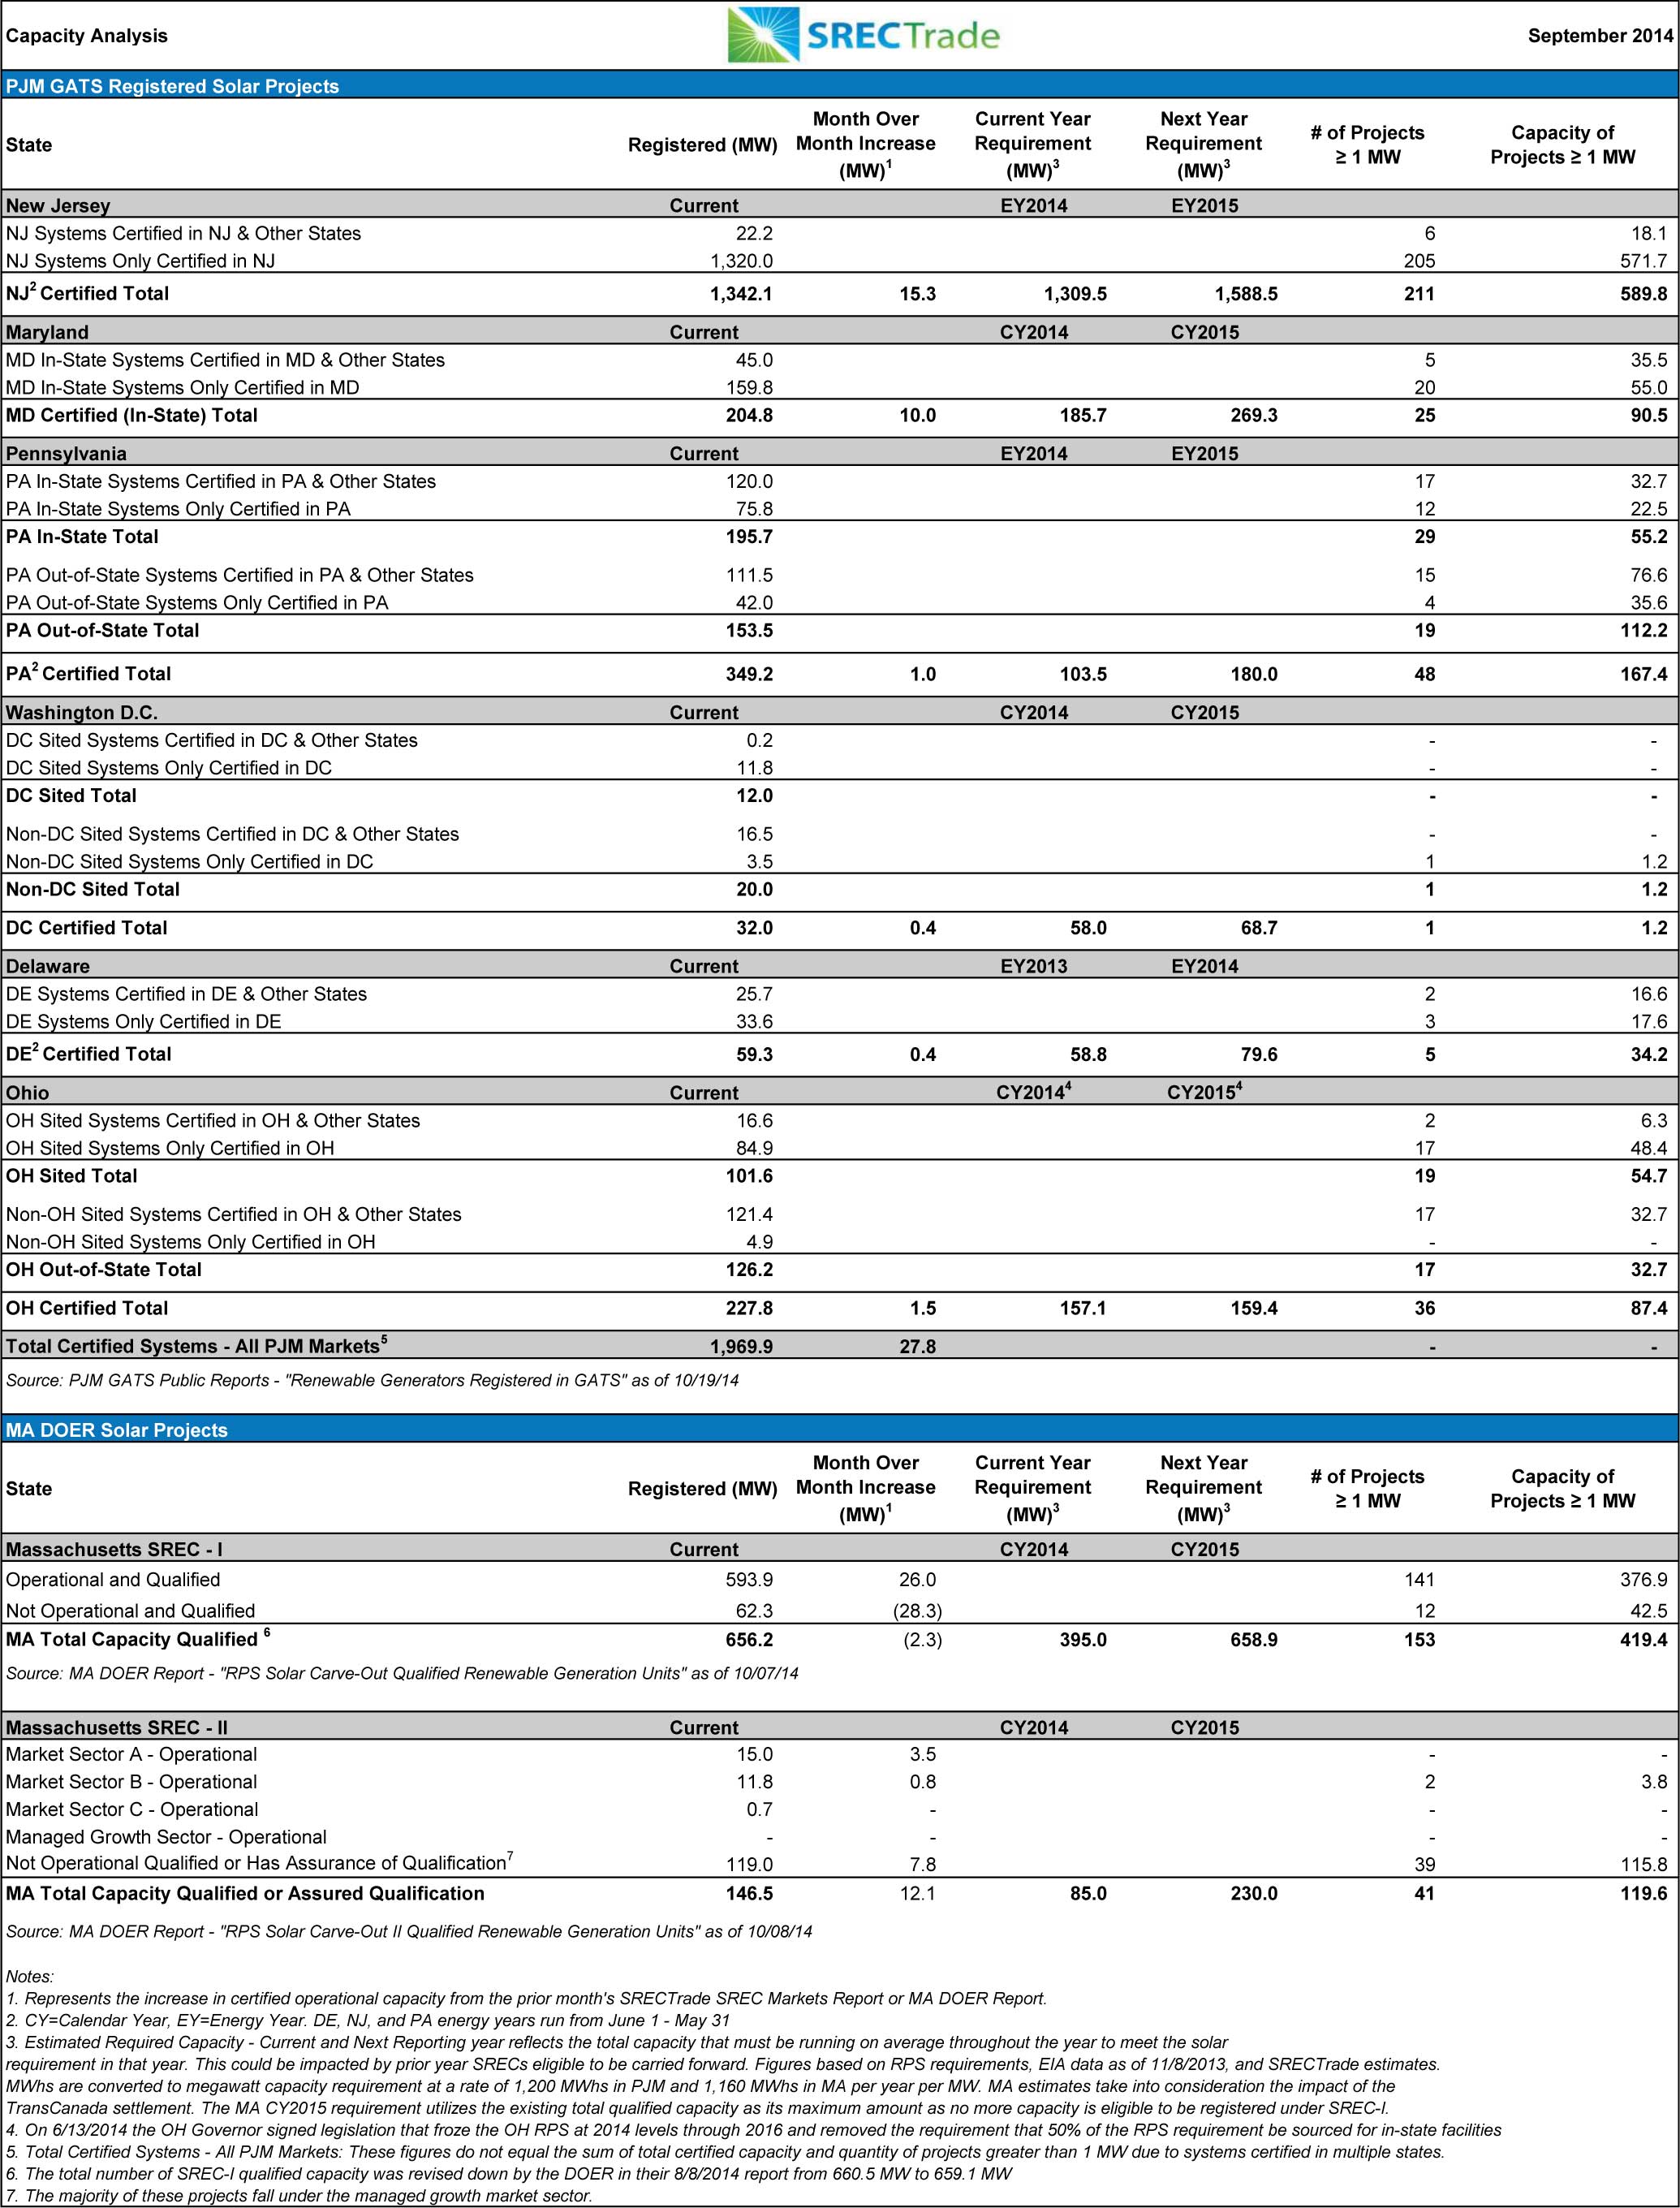
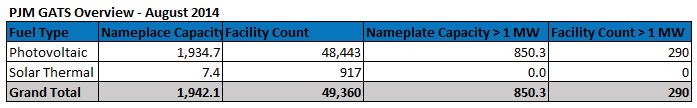
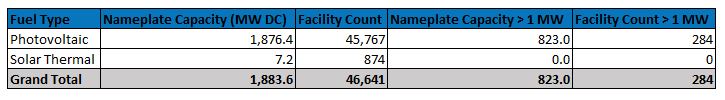
Overview of PJM Eligible Systems Through 2/4/2015

There are 55,478 facilities registered in GATS as of 2/4/2015. See below for a more detailed breakdown.

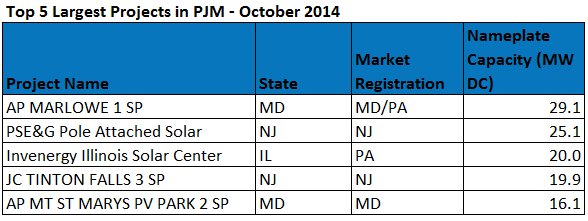
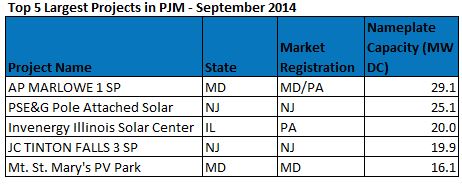
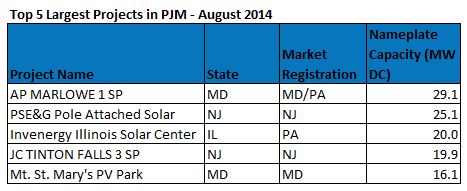
There are 300 projects over 1 MW in capacity, representing 872.9 MW or 42.6% of the qualified capacity. The largest projects in PJM are concentrated in NJ and MD. There are 38 projects over 5 MW or larger. These make up 18.3% of all qualified capacity in PJM. The top 5 largest projects are listed below.

Screenshot_021915_085038_PM

NJ Office of Clean Energy Estimated Installed Capacity Through 1/31/15

On February 6, 2015, the New Jersey Office of Clean Energy (OCE) announced total installed solar capacity reached 1,438.9 MW through 1/31/15; an increase of approximately 7.0 MW over the total capacity reported through the end of January 2015. The average last six month build rate per month, according to the OCE data, is 17.0 MW. Note that this data does not directly tie to GATS registration data because of a lag between NJ Office of Clean Energy certifications and GATS registrations.

Overview of MA DOER SREC-I and SREC-II Eligible Systems

SREC-I Program

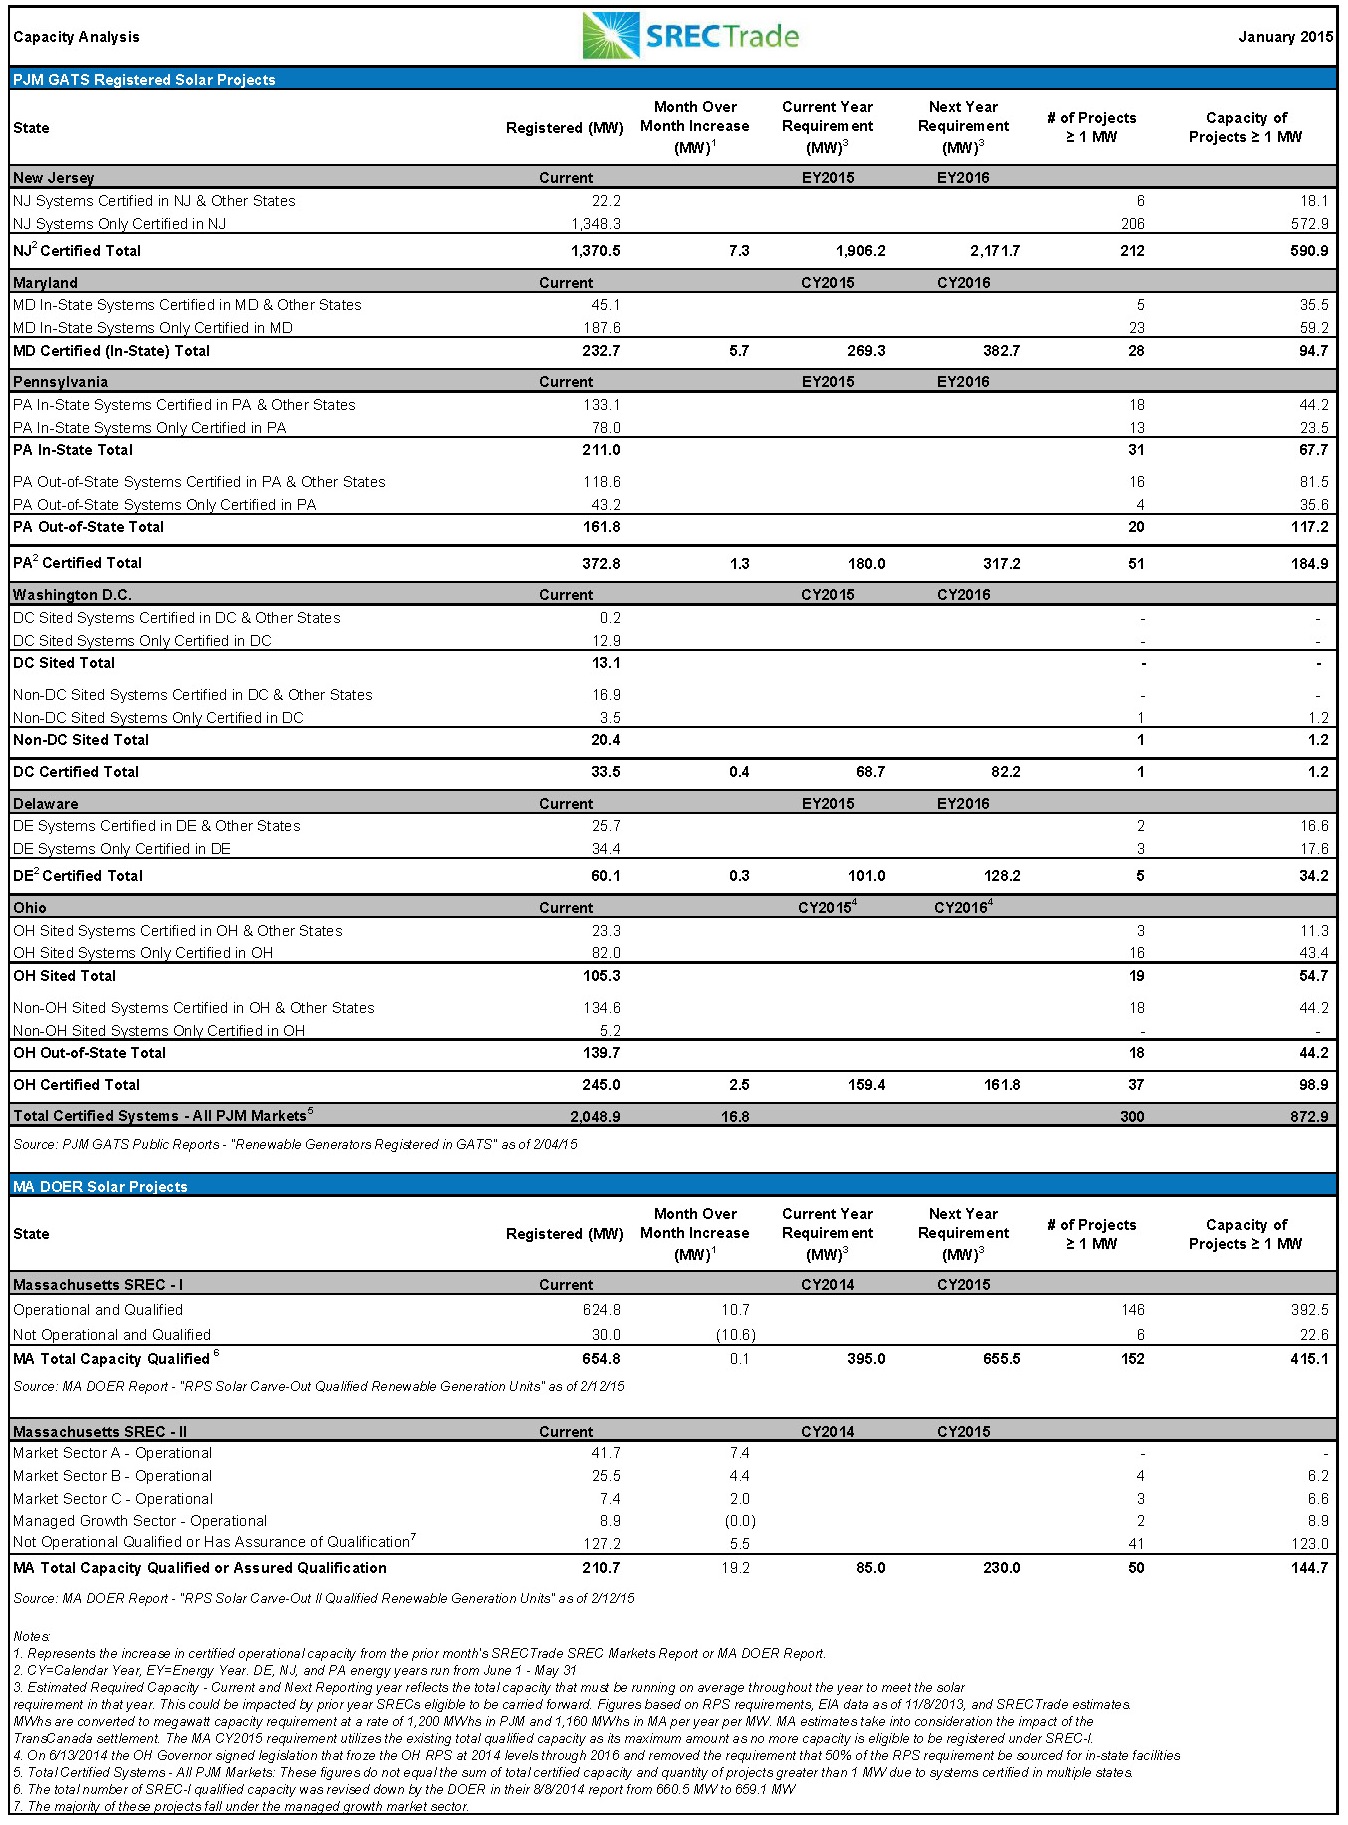
The Massachusetts SREC-I program was capped on June 30, 2014. As of 2/12/2015 the DOER reported that 30.0 MW of solar is still listed as Qualified but not operational. In total, 654.8 MW of capacity is listed as qualified, of which 624.8 MW is operational.

SREC-II Program

The SREC-II program opened on April 25, 2014. The program is broken in to Market Sectors. For a detailed overview of the regulations regarding SREC-II please visit here. As of 2/12/2015, 210.7 MW of capacity is currently qualified under the SREC-II program, but only 83.5 MW is operational.

How to Interpret The Capacity Table at the Top of this Post

The tables above demonstrate the capacity breakout by state. Note, that for all PJM GATS registered projects, each state includes all projects certified to sell into that state. State RPS programs that allow for systems sited in other states to participate have been broken up by systems sited in-state and out-of-state. Additional detail has been provided to demonstrate the total capacity of systems only certified for one specific state market versus being certified for multiple state markets. For example, PA includes projects only certified to sell into the PA SREC market, broken out by in-state and out-of-state systems, as well as projects that are also certified to sell into PA and Other State markets broken out by in state and out of state systems (i.e. OH, DC, MD, DE, NJ). PA Out-of-State includes systems sited in states with their own state SREC market (i.e. DE) as well as systems sited in states that have no SREC market (i.e. VA). Also, it is important to note that the Current Capacity represents the total megawatts eligible to produce and sell SRECs as of the noted date, while the Estimated Required Capacity – Current and Next Reporting Year represents the estimated number of MW that need to be online on average throughout the reporting period to meet the RPS requirement within each state with only that particular compliance period vintage. For example, New Jersey needed approximately 496.7 MW online for the entire 2013 reporting year to meet the RPS requirement with 2013 vintage SRECs only. SRECs still available from prior eligible periods can also impact the Solar RPS requirements. Additionally, the data presented above does not include projects that are in the pipeline or currently going through the registration process in each state program. This data represents specifically the projects that have been approved for the corresponding state SREC markets as of the dates noted.

Note: SREC requirements for markets without fixed SREC targets have been forecast based on EIA Report “Retail Sales of Electricity by State by Provider” updated 11/8/13. Projected SRECs required utilizes the most recent EIA electricity data applying an average 1.5% growth rate per forecast year. The state’s RPS Solar requirement is then multiplied by forecast total electricity sales to arrive at projected SRECs required. Projected capacity required is based on a factor of 1,200 MWh in PJM states and 1,160 MWh in MA, generated per MW of installed capacity per year.

SRECTrade Markets Report: December 2014

Posted January 15th, 2015 by SRECTrade.

The following post is a monthly update outlining the megawatts of solar capacity certified to create SRECs in the Solar REC markets that SRECTrade serves. All PJM data is based on the information available in PJM GATS as of the date noted. All MA data is based on the information provided by the DOER as of the date noted. This analysis does not include projects that are not yet registered and certified with the entities noted herein.

A PDF copy of this table can be found here.

Capacity_December2014_jpeg

Overview of PJM Eligible Systems Through 1/6/2015

There are 54,095 facilities registered in GATS as of 1/6/2015. See below for a more detailed breakdown.

Screenshot_011515_054406_PM

There are 300 projects over 1 MW in capacity (up one from November), representing 879.1 MW or 43.3% of the qualified capacity. The largest projects in PJM are concentrated in NJ and MD. There are 39 projects over 5 MW or larger. These make up 18.9% of all qualified capacity in PJM. The top 5 largest projects are listed below.

Dec14 Top 5

NJ Office of Clean Energy Estimated Installed Capacity Through 12/31/14

On January 13, 2015, the New Jersey Office of Clean Energy (OCE) announced total installed solar capacity reached 1,415.9 MW through 12/31/14; an increase of approximately 42.5 MW over the total capacity reported through the end of November 2014. Three (3) projects made up 27.4 MW of the total capacity installed. The average last six month build rate per month, according to the OCE data, is 16.1 MW. Note that this data does not directly tie to GATS registration data because of a lag between NJ Office of Clean Energy certifications and GATS registrations.
Note: On January 22, 2015, the New Jersey Office of Clean Energy (OCE) announced by email that the cumulative solar capacity installed through 12/31/14 was initially understated by 16.0 MW. This additional capacity was comprised of 2 large, grid supply projects. The total installed capacity as of January 22nd was revised to 1,431.9 MW.

Overview of MA DOER SREC-I and SREC-II Eligible Systems

SREC-I Program

The Massachusetts SREC-I program was capped on June 30, 2014. As of 1/12/2015 the DOER reported that 40.6 MW of solar is still listed as Qualified but not operational. In total, 654.7 MW of capacity is listed as qualified, of which 614.1 MW is operational.

SREC-II Program

The SREC-II program opened on April 25, 2014. The program is broken in to Market Sectors. For a detailed overview of the regulations regarding SREC-II please visit here. As of 1/12/2015, 191.5 MW of capacity is currently qualified under the SREC-II program, but only 69.8 MW is operational.

How to Interpret The Capacity Table at the Top of this Post

The tables above demonstrate the capacity breakout by state. Note, that for all PJM GATS registered projects, each state includes all projects certified to sell into that state. State RPS programs that allow for systems sited in other states to participate have been broken up by systems sited in-state and out-of-state. Additional detail has been provided to demonstrate the total capacity of systems only certified for one specific state market versus being certified for multiple state markets. For example, PA includes projects only certified to sell into the PA SREC market, broken out by in-state and out-of-state systems, as well as projects that are also certified to sell into PA and Other State markets broken out by in state and out of state systems (i.e. OH, DC, MD, DE, NJ). PA Out-of-State includes systems sited in states with their own state SREC market (i.e. DE) as well as systems sited in states that have no SREC market (i.e. VA). Also, it is important to note that the Current Capacity represents the total megawatts eligible to produce and sell SRECs as of the noted date, while the Estimated Required Capacity – Current and Next Reporting Year represents the estimated number of MW that need to be online on average throughout the reporting period to meet the RPS requirement within each state with only that particular compliance period vintage. For example, New Jersey needed approximately 496.7 MW online for the entire 2013 reporting year to meet the RPS requirement with 2013 vintage SRECs only. SRECs still available from prior eligible periods can also impact the Solar RPS requirements. Additionally, the data presented above does not include projects that are in the pipeline or currently going through the registration process in each state program. This data represents specifically the projects that have been approved for the corresponding state SREC markets as of the dates noted.

Note: SREC requirements for markets without fixed SREC targets have been forecast based on EIA Report “Retail Sales of Electricity by State by Provider” updated 11/8/13. Projected SRECs required utilizes the most recent EIA electricity data applying an average 1.5% growth rate per forecast year. The state’s RPS Solar requirement is then multiplied by forecast total electricity sales to arrive at projected SRECs required. Projected capacity required is based on a factor of 1,200 MWh in PJM states and 1,160 MWh in MA, generated per MW of installed capacity per year.

SRECTrade Markets Report: November 2014

Posted December 19th, 2014 by SRECTrade.

The following post is a monthly update outlining the megawatts of solar capacity certified to create SRECs in the Solar REC markets that SRECTrade serves. All PJM data is based on the information available in PJM GATS as of the date noted. All MA data is based on the information provided by the DOER as of the date noted. This analysis does not include projects that are not yet registered and certified with the entities noted herein.

A PDF copy of this table can be found here.

Capacity_November2014 copy

Overview of PJM Eligible Systems Through 12/16/2014

There are 52,951 facilities registered in GATS as of 12/16/2014. See below for a more detailed breakdown.

Screenshot_121914_043643_PM

There are 299 projects over 1 MW in capacity (up two from October), representing 877.1 MW or 43.5% of the qualified capacity. The largest projects in PJM are concentrated in NJ and MD. There are 39 projects over 5 MW or larger. These make up 19.1% of all qualified capacity in PJM. The top 5 largest projects are listed below.

Screenshot_121914_045005_PM

NJ Office of Clean Energy Estimated Installed Capacity Through 11/30/14

On December 19, 2014, the New Jersey Office of Clean Energy (OCE) announced total installed solar capacity reached 1,373.4 MW through 11/30/14; an increase of approximately 7.7 MW over the total capacity reported through the end of October 2014. The average last six month build rate per month, according to the OCE data, is 12.6 MW. Note that this data does not directly tie to GATS registration data because of a lag between NJ Office of Clean Energy certifications and GATS registrations.

Overview of MA DOER SREC-I and SREC-II Eligible Systems

SREC-I Program

The Massachusetts SREC-I program was capped on June 30, 2014. As of 12/09/2014 the DOER reported that 46.5 MW of solar is still listed as Qualified but not operational. In total, 655.5 MW of capacity is listed as qualified, of which 608.9 MW is operational.

SREC-II Program

The SREC-II program opened on April 25, 2014. The program is broken in to Market Sectors. For a detailed overview of the regulations regarding SREC-II please visit here. As of 12/09/2014, 180.2 MW of capacity is currently qualified under the SREC-II program, but only 42.3 MW is operational.

How to Interpret The Capacity Table at the Top of this Post

The tables above demonstrate the capacity breakout by state. Note, that for all PJM GATS registered projects, each state includes all projects certified to sell into that state. State RPS programs that allow for systems sited in other states to participate have been broken up by systems sited in-state and out-of-state. Additional detail has been provided to demonstrate the total capacity of systems only certified for one specific state market versus being certified for multiple state markets. For example, PA includes projects only certified to sell into the PA SREC market, broken out by in-state and out-of-state systems, as well as projects that are also certified to sell into PA and Other State markets broken out by in state and out of state systems (i.e. OH, DC, MD, DE, NJ). PA Out-of-State includes systems sited in states with their own state SREC market (i.e. DE) as well as systems sited in states that have no SREC market (i.e. VA). Also, it is important to note that the Current Capacity represents the total megawatts eligible to produce and sell SRECs as of the noted date, while the Estimated Required Capacity – Current and Next Reporting Year represents the estimated number of MW that need to be online on average throughout the reporting period to meet the RPS requirement within each state with only that particular compliance period vintage. For example, New Jersey needed approximately 496.7 MW online for the entire 2013 reporting year to meet the RPS requirement with 2013 vintage SRECs only. SRECs still available from prior eligible periods can also impact the Solar RPS requirements. Additionally, the data presented above does not include projects that are in the pipeline or currently going through the registration process in each state program. This data represents specifically the projects that have been approved for the corresponding state SREC markets as of the dates noted.

Note: SREC requirements for markets without fixed SREC targets have been forecast based on EIA Report “Retail Sales of Electricity by State by Provider” updated 11/8/13. Projected SRECs required utilizes the most recent EIA electricity data applying an average 1.5% growth rate per forecast year. The state’s RPS Solar requirement is then multiplied by forecast total electricity sales to arrive at projected SRECs required. Projected capacity required is based on a factor of 1,200 MWh in PJM states and 1,160 MWh in MA, generated per MW of installed capacity per year.

SRECTrade Markets Report: October 2014

Posted November 19th, 2014 by SRECTrade.

The following post is a monthly update outlining the megawatts of solar capacity certified to create SRECs in the Solar REC markets that SRECTrade serves. All PJM data is based on the information available in PJM GATS as of the date noted. All MA data is based on the information provided by the DOER as of the date noted. This analysis does not include projects that are not yet registered and certified with the entities noted herein.

A PDF copy of this table can be found here.

Capacity_October2014

Overview of PJM Eligible Systems Through 11/13/2014

There are 51,711 facilities registered in GATS as of 11/13/2014. See below for a more detailed breakdown.

Screenshot_111814_114643_PM

There are 297 projects over 1 MW in capacity (up three from September), representing 864.6 MW or 43.5% of the qualified capacity. The largest projects in PJM are concentrated in NJ and MD. There are 38 projects over 5 MW or larger. These make up 18.8% of all qualified capacity in PJM. The top 5 largest projects are listed below.

Screenshot_111814_115004_PM

NJ Office of Clean Energy Estimated Installed Capacity Through 10/31/14

On November 13, 2014, the New Jersey Office of Clean Energy (OCE) announced total installed solar capacity reached 1,365.7 MW through 10/31/14; an increase of approximately 11.6 MW over the total capacity reported through the end of September 2014. The average last six month build rate per month, according to the OCE data, is 15.5 MW. Note that this data does not directly tie to GATS registration data because of a lag between NJ Office of Clean Energy certifications and GATS registrations.

Overview of MA DOER SREC-I and SREC-II Eligible Systems

SREC-I Program

The Massachusetts SREC-I program was capped on June 30, 2014, however 46.5 MW of solar is still listed as Qualified but not operational on an update report issued by the DOER on 11/12/2014. In total, 656.2 MW of capacity is listed as currently qualified, of which 609.7 MW of capacity is operational.

SREC-II Program

The SREC-II program opened on April 25, 2014. The program is broken in to Market Sectors. For a detailed overview of the regulations regarding SREC-II please visit here. As of 11/12/2014, 164.7 MW of capacity is currently qualified under the SREC-II program, but only 34.4 MW is operational.

How to Interpret The Capacity Table at the Top of this Post

The tables above demonstrate the capacity breakout by state. Note, that for all PJM GATS registered projects, each state includes all projects certified to sell into that state. State RPS programs that allow for systems sited in other states to participate have been broken up by systems sited in-state and out-of-state. Additional detail has been provided to demonstrate the total capacity of systems only certified for one specific state market versus being certified for multiple state markets. For example, PA includes projects only certified to sell into the PA SREC market, broken out by in-state and out-of-state systems, as well as projects that are also certified to sell into PA and Other State markets broken out by in state and out of state systems (i.e. OH, DC, MD, DE, NJ). PA Out-of-State includes systems sited in states with their own state SREC market (i.e. DE) as well as systems sited in states that have no SREC market (i.e. VA). Also, it is important to note that the Current Capacity represents the total megawatts eligible to produce and sell SRECs as of the noted date, while the Estimated Required Capacity – Current and Next Reporting Year represents the estimated number of MW that need to be online on average throughout the reporting period to meet the RPS requirement within each state with only that particular compliance period vintage. For example, New Jersey needed approximately 496.7 MW online for the entire 2013 reporting year to meet the RPS requirement with 2013 vintage SRECs only. SRECs still available from prior eligible periods can also impact the Solar RPS requirements. Additionally, the data presented above does not include projects that are in the pipeline or currently going through the registration process in each state program. This data represents specifically the projects that have been approved for the corresponding state SREC markets as of the dates noted.

Note: SREC requirements for markets without fixed SREC targets have been forecast based on EIA Report “Retail Sales of Electricity by State by Provider” updated 11/8/13. Projected SRECs required utilizes the most recent EIA electricity data applying an average 1.5% growth rate per forecast year. The state’s RPS Solar requirement is then multiplied by forecast total electricity sales to arrive at projected SRECs required. Projected capacity required is based on a factor of 1,200 MWh in PJM states and 1,160 MWh in MA, generated per MW of installed capacity per year.

SRECTrade Markets Report: September 2014

Posted October 21st, 2014 by SRECTrade.

The following post is a monthly update outlining the megawatts of solar capacity certified to create SRECs in the Solar REC markets that SRECTrade serves. All PJM data is based on the information available in PJM GATS as of the date noted. All MA data is based on the information provided by the DOER as of the date noted. This analysis does not include projects that are not yet registered and certified with the entities noted herein.

A PDF copy of this table can be found here.

Capacity_September2014

Overview of PJM Eligible Systems Through 10/19/2014

There are 50,709 facilities registered in GATS as of 10/19/2014. See below for a more detailed breakdown.

PJM overview sept 14

There are 294 projects over 1 MW in capacity (up four from August), representing 861.2 MW or 43.7% of the qualified capacity. The largest projects in PJM are concentrated in NJ and MD. There are 38 projects over 5 MW or larger. These make up 18.9% of all qualified capacity in PJM. The top 5 largest projects are listed below.

top largest sept 14

NJ Office of Clean Energy Estimated Installed Capacity Through 9/30/14

On October 14, 2014, the New Jersey Office of Clean Energy (OCE) announced total installed solar capacity reached 1,354.0 MW through 9/30/14; an increase of approximately 9.3 MW over the total capacity reported through the end of August 2014. The average last six month build rate per month, according to the OCE data, is 14.5 MW. Note that this data does not directly tie to GATS registration data because of a lag between NJ Office of Clean Energy certifications and GATS registrations.

Overview of MA DOER SREC-I and SREC-II Eligible Systems

SREC-I Program

The Massachusetts SREC-I program was capped on June 30, 2014, however 62.3 MW of solar is still listed as Qualified but not operational on an update report issued by the DOER on 10/7/2014. In total, 656.2 MW of capacity is listed as currently qualified, of which 593.9 MW of capacity is operational.

SREC-II Program

The SREC-II program opened on April 25, 2014. The program is broken in to Market Sectors. For a detailed overview of the regulations regarding SREC-II please visit here. As of 10/8/2014, 146.5 MW of capacity is currently qualified under the SREC-II program, but only 27.5 MW is operational.

How to Interpret The Capacity Table at the Top of this Post

The tables above demonstrate the capacity breakout by state. Note, that for all PJM GATS registered projects, each state includes all projects certified to sell into that state. State RPS programs that allow for systems sited in other states to participate have been broken up by systems sited in-state and out-of-state. Additional detail has been provided to demonstrate the total capacity of systems only certified for one specific state market versus being certified for multiple state markets. For example, PA includes projects only certified to sell into the PA SREC market, broken out by in-state and out-of-state systems, as well as projects that are also certified to sell into PA and Other State markets broken out by in state and out of state systems (i.e. OH, DC, MD, DE, NJ). PA Out-of-State includes systems sited in states with their own state SREC market (i.e. DE) as well as systems sited in states that have no SREC market (i.e. VA). Also, it is important to note that the Current Capacity represents the total megawatts eligible to produce and sell SRECs as of the noted date, while the Estimated Required Capacity – Current and Next Reporting Year represents the estimated number of MW that need to be online on average throughout the reporting period to meet the RPS requirement within each state with only that particular compliance period vintage. For example, New Jersey needed approximately 496.7 MW online for the entire 2013 reporting year to meet the RPS requirement with 2013 vintage SRECs only. SRECs still available from prior eligible periods can also impact the Solar RPS requirements. Additionally, the data presented above does not include projects that are in the pipeline or currently going through the registration process in each state program. This data represents specifically the projects that have been approved for the corresponding state SREC markets as of the dates noted.

Note: SREC requirements for markets without fixed SREC targets have been forecast based on EIA Report “Retail Sales of Electricity by State by Provider” updated 11/8/13. Projected SRECs required utilizes the most recent EIA electricity data applying an average 1.5% growth rate per forecast year. The state’s RPS Solar requirement is then multiplied by forecast total electricity sales to arrive at projected SRECs required. Projected capacity required is based on a factor of 1,200 MWh in PJM states and 1,160 MWh in MA, generated per MW of installed capacity per year.

SRECTrade Markets Report: August 2014

Posted September 17th, 2014 by SRECTrade.

The following post is a monthly update outlining the megawatts of solar capacity certified to create SRECs in the Solar REC markets that SRECTrade serves. All PJM data is based on the information available in PJM GATS as of the date noted. All MA data is based on the information provided by the DOER as of the date noted. This analysis does not include projects that are not yet registered and certified with the entities noted herein.

A PDF copy of this table can be found here.

Capacity_August2014

Overview of PJM Eligible Systems Through 9/16/2014

There are 49,360 facilities registered in GATS as of 9/16/2014. See below for a more detailed breakdown.

PV_STH_August2014

There are 290 projects over 1 MW in capacity (up one from July), representing 850.3 MW or 43.8% of the qualified capacity. The largest projects in PJM are concentrated in NJ and MD. There are 37 projects over 5 MW or larger. These make up 18.9% of all qualified capacity in PJM. The top 5 largest projects are listed below.

Top5_August2014

NJ Office of Clean Energy Estimated Installed Capacity Through 8/31/14

On September 18, 2014, the New Jersey Office of Clean Energy (OCE) announced total installed solar capacity reached 1,344.6 MW through 8/31/14; an increase of approximately 7.8 MW over the total capacity reported through the end of July 2014. The average last six month build rate per month, according to the OCE data, is 16.5 MW. Note that this data does not directly tie to GATS registration data because of a lag between NJ Office of Clean Energy certifications and GATS registrations.

Overview of MA DOER SREC-I and SREC-II Eligible Systems

SREC-I Program

The Massachusetts SREC-I program was capped on June 30, 2014, however 90.6 MW of solar is still listed as Qualified but not operational on an update report issued by the DOER on 9/8/2014. In total, 658.5 MW of capacity is listed as currently qualified, of which 567.9 MW of capacity is operational.

SREC-II Program

The SREC-II program opened on April 25, 2014. The program is broken in to Market Sectors. For a detailed overview of the regulations regarding SREC-II please visit here. Overall 134.4 MW of capacity is currently qualified under the SREC-II program, but only 23.2 MW is operational.

How to Interpret The Capacity Table at the Top of this Post

The tables above demonstrate the capacity breakout by state. Note, that for all PJM GATS registered projects, each state includes all projects certified to sell into that state. State RPS programs that allow for systems sited in other states to participate have been broken up by systems sited in-state and out-of-state. Additional detail has been provided to demonstrate the total capacity of systems only certified for one specific state market versus being certified for multiple state markets. For example, PA includes projects only certified to sell into the PA SREC market, broken out by in-state and out-of-state systems, as well as projects that are also certified to sell into PA and Other State markets broken out by in state and out of state systems (i.e. OH, DC, MD, DE, NJ). PA Out-of-State includes systems sited in states with their own state SREC market (i.e. DE) as well as systems sited in states that have no SREC market (i.e. VA). Also, it is important to note that the Current Capacity represents the total megawatts eligible to produce and sell SRECs as of the noted date, while the Estimated Required Capacity – Current and Next Reporting Year represents the estimated number of MW that need to be online on average throughout the reporting period to meet the RPS requirement within each state with only that particular compliance period vintage. For example, New Jersey needed approximately 496.7 MW online for the entire 2013 reporting year to meet the RPS requirement with 2013 vintage SRECs only. SRECs still available from prior eligible periods can also impact the Solar RPS requirements. Additionally, the data presented above does not include projects that are in the pipeline or currently going through the registration process in each state program. This data represents specifically the projects that have been approved for the corresponding state SREC markets as of the dates noted.

Note: SREC requirements for markets without fixed SREC targets have been forecast based on EIA Report “Retail Sales of Electricity by State by Provider” updated 11/8/13. Projected SRECs required utilizes the most recent EIA electricity data applying an average 1.5% growth rate per forecast year. The state’s RPS Solar requirement is then multiplied by forecast total electricity sales to arrive at projected SRECs required. Projected capacity required is based on a factor of 1,200 MWh in PJM states and 1,160 MWh in MA, generated per MW of installed capacity per year.

SRECTrade Markets Report: July 2014

Posted August 19th, 2014 by SRECTrade.

The following post is a monthly update outlining the megawatts of solar capacity certified to create SRECs in the Solar REC markets that SRECTrade serves. All PJM data is based on the information available in PJM GATS as of the date noted. All MA data is based on the information provided by the DOER as of the date noted. This analysis does not include projects that are not yet registered and certified with the entities noted herein.

A PDF copy of this table can be found here.

Capacity_July2014

Overview of PJM Eligible Systems Through 8/12/2014

There are 47,711 facilities registered in GATS as of 8/12/2014. See below for a more detailed breakdown.

July 2014 Summary

There are 289 projects over 1 MW in capacity (up five from June), representing 840.9 MW or 43.9% of the qualified capacity. The largest projects in the PJM are concentrated in NJ and MD. There are 36 projects over 5 MW or larger. These make up 18.7% of all qualified capacity in the PJM. The top 5 largest projects are listed below.

July 2014 Top 5 Projects

NJ Office of Clean Energy Estimated Installed Capacity Through 7/31/14

On August 13, 2014, the New Jersey Office of Clean Energy (OCE) announced total installed solar capacity reached 1,336.8 MW through 7/31/14; an increase of approximately 17.6 MW over the total capacity reported through the end of June 2014. The average last six month build rate per month, according to the OCE data, is 22.6 MW. Note that this data does not directly tie to GATS registration data because of a lag between NJ Office of Clean Energy certifications and GATS registrations.

Overview of MA DOER SREC-I and SREC-II Eligible Systems

SREC-I Program

The Massachusetts SREC-I program was capped on June 30, 2014, however 110.8 MW of solar is still listed as Qualified but not operational on an update report issued by the DOER on 8/8/2014. In total, 659.1 MW of capacity is listed as currently qualified, of which 548.3 MW of capacity is operational. Note that the total number of SREC-I qualified capacity was revised down by the DOER in the 8/8/2014 report from 660.5 MW to 659.1 MW.

SREC-II Program

The SREC-II program opened on April 25, 2014. The program is broken in to Market Sectors. For a detailed overview of the regulations regarding SREC-II please visit here. Overall 124.0 MW of capacity is currently qualified under the SREC-II program, but only 14.3 MW is operational.

How to Interpret The Capacity Table at the Top of this Post

The tables above demonstrate the capacity breakout by state. Note, that for all PJM GATS registered projects, each state includes all projects certified to sell into that state. State RPS programs that allow for systems sited in other states to participate have been broken up by systems sited in-state and out-of-state. Additional detail has been provided to demonstrate the total capacity of systems only certified for one specific state market versus being certified for multiple state markets. For example, PA includes projects only certified to sell into the PA SREC market, broken out by in-state and out-of-state systems, as well as projects that are also certified to sell into PA and Other State markets broken out by in state and out of state systems (i.e. OH, DC, MD, DE, NJ). PA Out-of-State includes systems sited in states with their own state SREC market (i.e. DE) as well as systems sited in states that have no SREC market (i.e. VA). Also, it is important to note that the Current Capacity represents the total megawatts eligible to produce and sell SRECs as of the noted date, while the Estimated Required Capacity – Current and Next Reporting Year represents the estimated number of MW that need to be online on average throughout the reporting period to meet the RPS requirement within each state with only that particular compliance period vintage. For example, New Jersey needed approximately 496.7 MW online for the entire 2013 reporting year to meet the RPS requirement with 2013 vintage SRECs only. SRECs still available from prior eligible periods can also impact the Solar RPS requirements. Additionally, the data presented above does not include projects that are in the pipeline or currently going through the registration process in each state program. This data represents specifically the projects that have been approved for the corresponding state SREC markets as of the dates noted.

Note: SREC requirements for markets without fixed SREC targets have been forecast based on EIA Report “Retail Sales of Electricity by State by Provider” updated 11/8/13. Projected SRECs required utilizes the most recent EIA electricity data applying an average 1.5% growth rate per forecast year. The state’s RPS Solar requirement is then multiplied by forecast total electricity sales to arrive at projected SRECs required. Projected capacity required is based on a factor of 1,200 MWh in PJM states and 1,160 MWh in MA, generated per MW of installed capacity per year.

SRECTrade Markets Report: June 2014

Posted July 22nd, 2014 by SRECTrade.

The following post is a monthly update outlining the megawatts of solar capacity certified to create SRECs in the Solar REC markets that SRECTrade serves. All PJM data is based on the information available in PJM GATS as of the date noted. All MA data is based on the information provided by the DOER as of the date noted. This analysis does not include projects that are not yet registered and certified with the entities noted herein.

A PDF copy of this table can be found here.

Capacity_June2014

Overview of PJM Eligible Systems Through 7/9/2014

There are 46,641 facilities registered in GATS as of 7/9/2014. See below for a more detailed breakdown.

Facility Breakdown

There are 284 projects over 1 MW in capacity, representing 823.0 MW or 43.7% of the qualified capacity. The largest projects in the PJM are concentrated in NJ and MD. There are 35 projects over 5 MW. These make up 18.7% of all qualified capacity in the PJM. The top 5 largest projects are listed below.

Top 5 for blog

NJ Office of Clean Energy Estimated Installed Capacity Through 7/8/14

On July 8, 2014, the New Jersey Office of Clean Energy (OCE) announced total installed solar capacity reached 1,319.2 MW; an increase of approximately 21.1 MW over the total capacity reported at the end of May. The average last six month build rate per month, according to the OCE data, is 22.5 MW. Note that this data does not directly tie to GATS registration data because of a lag between NJ Office of Clean Energy certifications and GATS registrations.

Overview of MA DOER SREC-I and II Eligible Systems

SREC-I Program

The Massachusetts SREC-I program was capped on June 30, 2014, however 125.1 MW of solar is still listed as “Qualified” but not operational on an update report issued by the DOER on 7/9/2014. In total, 660.5 MW of capacity is listed as currently qualified, of which 535.4 MW of capacity is operational.

SREC-II Program

The SREC-II program opened on April 25, 2014. The program is broken in to Market Sectors. For a detailed overview of the regulations regarding SREC-II please visit here. Overall 117.4 MW of capacity is currently qualified under the SREC-II program, but only 8.1 MW is operational.

How to Interpret The Capacity Table at the Top of this Post

The tables above demonstrate the capacity breakout by state. Note, that for all PJM GATS registered projects, each state includes all projects certified to sell into that state. State RPS programs that allow for systems sited in other states to participate have been broken up by systems sited in-state and out-of-state. Additional detail has been provided to demonstrate the total capacity of systems only certified for one specific state market versus being certified for multiple state markets. For example, PA includes projects only certified to sell into the PA SREC market, broken out by in-state and out-of-state systems, as well as projects that are also certified to sell into PA and Other State markets broken out by in state and out of state systems (i.e. OH, DC, MD, DE, NJ). PA Out-of-State includes systems sited in states with their own state SREC market (i.e. DE) as well as systems sited in states that have no SREC market (i.e. VA). Also, it is important to note that the Current Capacity represents the total megawatts eligible to produce and sell SRECs as of the noted date, while the Estimated Required Capacity – Current and Next Reporting Year represents the estimated number of MW that need to be online on average throughout the reporting period to meet the RPS requirement within each state with only that particular compliance period vintage. For example, New Jersey needed approximately 496.7 MW online for the entire 2013 reporting year to meet the RPS requirement with 2013 vintage SRECs only. SRECs still available from prior eligible periods can also impact the Solar RPS requirements. Additionally, the data presented above does not include projects that are in the pipeline or currently going through the registration process in each state program. This data represents specifically the projects that have been approved for the corresponding state SREC markets as of the dates noted.

Note: SREC requirements for markets without fixed SREC targets have been forecast based on EIA Report “Retail Sales of Electricity by State by Provider” updated 11/8/13. Projected SRECs required utilizes the most recent EIA electricity data applying an average 1.5% growth rate per forecast year. The state’s RPS Solar requirement is then multiplied by forecast total electricity sales to arrive at projected SRECs required. Projected capacity required is based on a factor of 1,200 MWh in PJM states and 1,160 MWh in MA, generated per MW of installed capacity per year.

SRECTrade Markets Report: May 2014

Posted June 17th, 2014 by SRECTrade.

The following post is a monthly update outlining the megawatts of solar capacity certified to create SRECs in the Solar REC markets that SRECTrade serves. All PJM data is based on the information available in PJM GATS as of the date noted. All MA data is based on the information provided by the DOER as of the date noted. This analysis does not include projects that are not yet registered and certified with the entities noted herein.

A PDF copy of this table can be found here.

May 2014 GATS SREC Capacity Analysis copy

Overview of PJM Eligible Systems

As of June 6, 2014 there were 44,244 solar PV and 866 solar thermal systems registered and eligible to create SRECs in the PJM Generation Attribute Tracking System (GATS). Of these, 281 (no change since April) have a nameplate capacity of 1 megawatt or greater and account for 43.4% of the overall capacity registered. Thirty-two (32) of these projects have a nameplate capacity of 5 MW or greater. The three largest projects are a 29.1 MW project certified in MD and PA, followed by a 25.1 MW certified in NJ and a 20.0 MW project sited in Illinois and registered in the PA market. This is unchanged from last month.

NJ Office of Clean Energy Estimated Installed Capacity Through 5/31/14

On June 10, 2014, the New Jersey Office of Clean Energy (OCE) announced total installed solar capacity reached 1,298.1 MW; an increase of approximately 25.2 MW over the total capacity reported at the end of April. The average last six month build rate per month, according to the OCE data, is 21.2 MW. Note that this data does not directly tie to GATS registration data because of a lag between NJ Office of Clean Energy certifications and GATS registrations.

Overview of MA DOER SREC-I Eligible Systems

As of June 6, 2014, there were 11,791 MA DOER qualified solar projects; 11,652 operational and 139 not operational.* Total qualified capacity is 669.5 MW; 484.1 MW of which is operational (up 29.7 MW from the DOER’s previous report) and 185.4 MW of qualified capacity is not yet operational under the current SREC-I program.

*Note: not operational, qualified projects over 100 kW in size were required to demonstrate that at least 50% of the project’s costs be incurred by 12/31/2013 in order to remain qualified. Projects less than 100 kW must be interconnected by the effective date of the SREC-II program or June 30, 2014, whichever is earlier. Whereas projects greater 100 kW in capacity must have submitted application paperwork and met certain requirements by July 5, 2013. For more information refer to our blog posts covering the current SREC program.

How to Interpret This Table

The tables above demonstrate the capacity breakout by state. Note, that for all PJM GATS registered projects, each state includes all projects certified to sell into that state. State RPS programs that allow for systems sited in other states to participate have been broken up by systems sited in-state and out-of-state. Additional detail has been provided to demonstrate the total capacity of systems only certified for one specific state market versus being certified for multiple state markets. For example, PA includes projects only certified to sell into the PA SREC market, broken out by in-state and out-of-state systems, as well as projects that are also certified to sell into PA and Other State markets broken out by in state and out of state systems (i.e. OH, DC, MD, DE, NJ). PA Out-of-State includes systems sited in states with their own state SREC market (i.e. DE) as well as systems sited in states that have no SREC market (i.e. VA). Also, it is important to note that the Current Capacity represents the total megawatts eligible to produce and sell SRECs as of the noted date, while the Estimated Required Capacity – Current and Next Reporting Year represents the estimated number of MW that need to be online on average throughout the reporting period to meet the RPS requirement within each state with only that particular compliance period vintage. For example, New Jersey needed approximately 496.7 MW online for the entire 2013 reporting year to meet the RPS requirement with 2013 vintage SRECs only. SRECs still available from prior eligible periods can also impact the Solar RPS requirements. Additionally, the data presented above does not include projects that are in the pipeline or currently going through the registration process in each state program. This data represents specifically the projects that have been approved for the corresponding state SREC markets as of the dates noted.

Note: SREC requirements for markets without fixed SREC targets have been forecast based on EIA Report “Retail Sales of Electricity by State by Provider” updated 11/8/13. Projected SRECs required utilizes the most recent EIA electricity data applying an average 1.5% growth rate per forecast year. The state’s RPS Solar requirement is then multiplied by forecast total electricity sales to arrive at projected SRECs required. Projected capacity required is based on a factor of 1,200 MWh in PJM states and 1,130 MWh in MA, generated per MW of installed capacity per year.

SRECTrade Markets Report: April 2014

Posted May 8th, 2014 by SRECTrade.

The following post is a monthly update outlining the megawatts of solar capacity certified to create SRECs in the Solar REC markets that SRECTrade serves. All PJM data is based on the information available in PJM GATS as of the date noted. All MA data is based on the information provided by the DOER as of the date noted. This analysis does not include projects that are not yet registered and certified with the entities noted herein.

A PDF copy of this table can be found here.

April 2014 SRECTrade Capacity Analysis

Overview of PJM Eligible Systems

As of May 5, 2014 there were 43,267 solar PV and 855 solar thermal systems registered and eligible to create SRECs in the PJM Generation Attribute Tracking System (GATS). Of these, 281 (up 1 project since March and representing 0.64% of the total number of projects installed) have a nameplate capacity of 1 megawatt or greater and account for 43.7% of the overall capacity registered. Thirty-two (32) of these projects have a nameplate capacity of 5 MW or greater. New Jersey continues to host most of the larger scale facilities, claiming home to 21 of the 32 facilities, that are equal to or greater than 5 MW. The three largest projects are a 29.1 MW project certified in MD and PA, followed by a 25.1 MW certified in NJ and a 20.0 MW project sited in Illinois and registered in the PA market.

NJ Office of Clean Energy Estimated Installed Capacity Through 4/30/14

On May 13, 2014, the New Jersey Office of Clean Energy (OCE) announced total installed solar capacity reached 1,272.9 MW; an increase of approximately 5.8 MW over the total capacity reported at the end of March. The average last six month build rate per month, according to the OCE data, is 19.6 MW. Note that this data does not directly tie to GATS registration data because of a lag between NJ Office of Clean Energy certifications and GATS registrations. For more information on the state of the NJ market see our latest webinar.

Overview of MA DOER Eligible Systems

As of May 1, 2014, there were 11,776 MA DOER qualified solar projects; 11,612 operational and 164 not operational.* Total qualified capacity is 686.3 MW; 454.4 MW of which is operational (up 10.5 MW from the DOER’s  previous report) and 231.9 MW of qualified capacity is not yet operational under the current SREC-I program.**

*Note: not operational, qualified projects over 100 kW in size were required to demonstrate that at least 50% of the project’s costs be incurred by 12/31/2013 in order to remain qualified. Projects less than 100 kW must be interconnected by the effective date of the SREC-II program or June 30, 2014, whichever is earlier. Whereas projects greater 100 kW in capacity must have submitted application paperwork and met certain requirements by July 5, 2013. For more information refer to our blog posts covering the current SREC program.

**Note: Facilities will begin to formally apply for the SREC-II program at some point in mid-May. The DOER’s SREC-II application system is expected to be available beginning May 13, 2014.

How to Interpret This Table

The tables above demonstrate the capacity breakout by state. Note, that for all PJM GATS registered projects, each state includes all projects certified to sell into that state. State RPS programs that allow for systems sited in other states to participate have been broken up by systems sited in-state and out-of-state. Additional detail has been provided to demonstrate the total capacity of systems only certified for one specific state market versus being certified for multiple state markets. For example, PA includes projects only certified to sell into the PA SREC market, broken out by in-state and out-of-state systems, as well as projects that are also certified to sell into PA and Other State markets broken out by in state and out of state systems (i.e. OH, DC, MD, DE, NJ). PA Out-of-State includes systems sited in states with their own state SREC market (i.e. DE) as well as systems sited in states that have no SREC market (i.e. VA). Also, it is important to note that the Current Capacity represents the total megawatts eligible to produce and sell SRECs as of the noted date, while the Estimated Required Capacity – Current and Next Reporting Year represents the estimated number of MW that need to be online on average throughout the reporting period to meet the RPS requirement within each state with only that particular compliance period vintage. For example, New Jersey needed approximately 496.7 MW online for the entire 2013 reporting year to meet the RPS requirement with 2013 vintage SRECs only. SRECs still available from prior eligible periods can also impact the Solar RPS requirements. Additionally, the data presented above does not include projects that are in the pipeline or currently going through the registration process in each state program. This data represents specifically the projects that have been approved for the corresponding state SREC markets as of the dates noted.

Note: SREC requirements for markets without fixed SREC targets have been forecast based on EIA Report “Retail Sales of Electricity by State by Provider” updated 10/1/12. Projected SRECs required utilizes the most recent EIA electricity data applying an average 1.5% growth rate per forecast year. The state’s RPS Solar requirement is then multiplied by forecast total electricity sales to arrive at projected SRECs required. Projected capacity required is based on a factor of 1,200 MWh in PJM states and 1,130 MWh in MA, generated per MW of installed capacity per year.