The following post is a monthly update outlining the megawatts of solar capacity certified to create SRECs in the Solar REC markets that SRECTrade serves. All PJM data is based on the information available in PJM GATS as of the date noted. All MA data is based on the information provided by the DOER as of the date noted. This analysis does not include projects that are not yet registered and certified with the entities noted herein.
A PDF copy of this table can be found here.

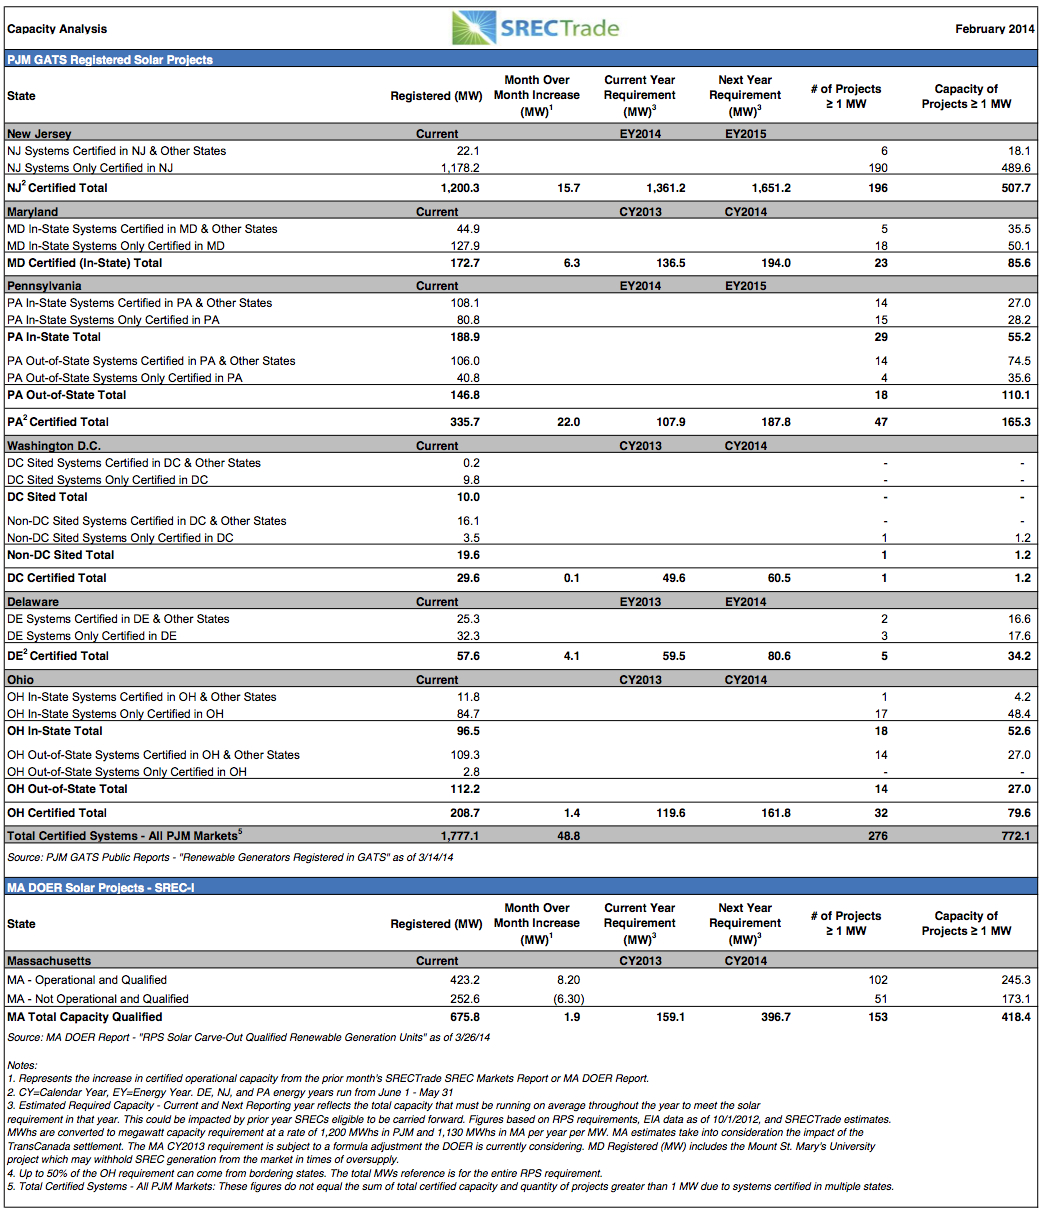
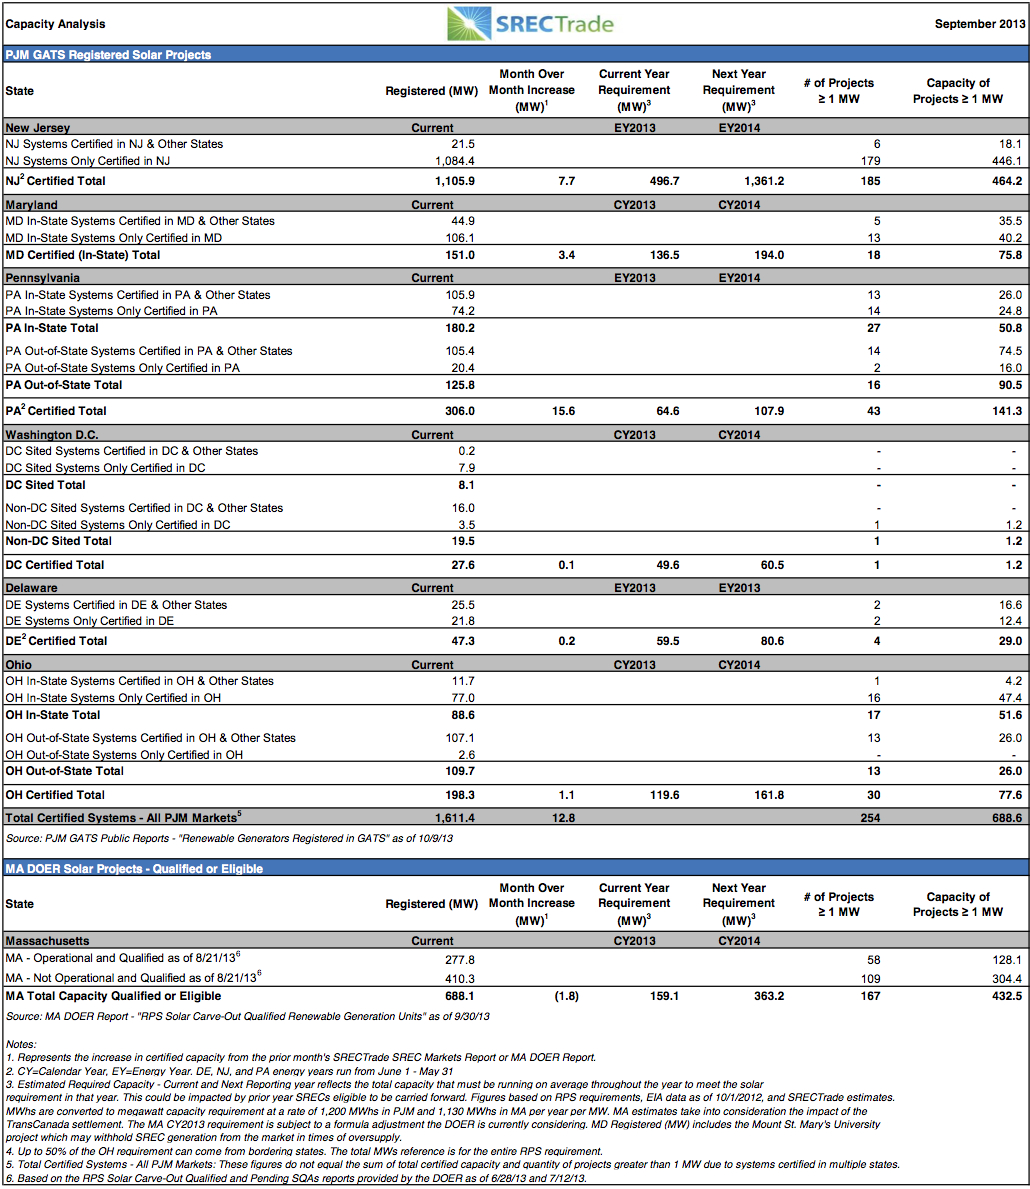
Overview of PJM Eligible Systems
As of April 14, 2014 there were 42,652 solar PV and 850 solar thermal systems registered and eligible to create SRECs in the PJM Generation Attribute Tracking System (GATS). Of these, 280 (up 4 projects since February and representing 0.64% of the total number of projects installed) have a nameplate capacity of 1 megawatt or greater and account for 43.8% of the overall capacity registered. Thirty (32) of these projects have a nameplate capacity of 5 MW or greater (an increase of 2 since our last update). New Jersey continues to host most of the larger scale facilities, claiming home to 21 of the 32 facilities, that are equal to or greater than 5 MW. The three largest projects are a 29.1 MW project in MD and PA, followed by a 25.1 MW in NJ and a 20.0 MW project sited in Illinois and registered in the PA market.
NJ Office of Clean Energy Estimated Installed Capacity Through 3/31/14
On April 15, 2014, the New Jersey Office of Clean Energy (OCE) announced total installed solar capacity reached 1,267.1 MW; an increase of approximately 20.3 MW over the total capacity reported at the end of February. The average last six month build rate per month, according to the OCE data, is 20.8 MW. Note that this data does not directly tie to GATS registration data because of a lag between NJ Office of Clean Energy certifications and GATS registrations. For more information on the state of the NJ market see our latest webinar.
Overview of MA DOER Eligible Systems
As of March 26, 2014, there were 10,519 MA DOER qualified solar projects; 10,346 operational and 173 not operational. Total qualified capacity is 675.8 MW; 423.2 MW of which is operational (up 8.2 MW from the DOER’s February 2014 report) and 252.6 MW of qualified capacity is not yet operational under the current SREC-I program.
*Note: not operational, qualified projects over 100 kW in size were required to demonstrate that at least 50% of the project’s costs be incurred by 12/31/2013 in order to remain qualified. The latest DOER Solar Carve Out report suggests that at least 22.3 MW of capacity was removed from eligibility for failing to meet the requirements of this deadline. Projects less than 100 kW must be interconnected by the effective date of the SREC-II program or June 30, 2014, whichever is earlier. Whereas projects greater 100 kW in capacity must have submitted application paperwork and met certain requirements by July 5, 2013. For more information refer to our blog posts covering the current SREC program.
How to Interpret This Table
The tables above demonstrate the capacity breakout by state. Note, that for all PJM GATS registered projects, each state includes all projects certified to sell into that state. State RPS programs that allow for systems sited in other states to participate have been broken up by systems sited in-state and out-of-state. Additional detail has been provided to demonstrate the total capacity of systems only certified for one specific state market versus being certified for multiple state markets. For example, PA includes projects only certified to sell into the PA SREC market, broken out by in-state and out-of-state systems, as well as projects that are also certified to sell into PA and Other State markets broken out by in state and out of state systems (i.e. OH, DC, MD, DE, NJ). PA Out-of-State includes systems sited in states with their own state SREC market (i.e. DE) as well as systems sited in states that have no SREC market (i.e. VA). Also, it is important to note that the Current Capacity represents the total megawatts eligible to produce and sell SRECs as of the noted date, while the Estimated Required Capacity – Current and Next Reporting Year represents the estimated number of MW that need to be online on average throughout the reporting period to meet the RPS requirement within each state with only that particular compliance period vintage. For example, New Jersey needed approximately 496.7 MW online for the entire 2013 reporting year to meet the RPS requirement with 2013 vintage SRECs only. SRECs still available from prior eligible periods can also impact the Solar RPS requirements. Additionally, the data presented above does not include projects that are in the pipeline or currently going through the registration process in each state program. This data represents specifically the projects that have been approved for the corresponding state SREC markets as of the dates noted.
Note: SREC requirements for markets without fixed SREC targets have been forecast based on EIA Report “Retail Sales of Electricity by State by Provider” updated 10/1/12. Projected SRECs required utilizes the most recent EIA electricity data applying an average 1.5% growth rate per forecast year. The state’s RPS Solar requirement is then multiplied by forecast total electricity sales to arrive at projected SRECs required. Projected capacity required is based on a factor of 1,200 MWh in PJM states and 1,130 MWh in MA, generated per MW of installed capacity per year.
Tweet