Posts Tagged ‘Solar Carve-Out’

Solar Capacity in the SREC States – July 2011

Posted July 26th, 2011 by SRECTrade.

SRECTrade SREC Markets Report: July 2011

The following post outlines the megawatts of solar capacity certified and/or registered to create SRECs in the SREC markets SRECTrade currently serves.

For a PDF copy of this table click here.

Capacity_July11

PJM Eligible Systems

As of the end of July, there were 17,106 solar PV (16,792) and solar thermal (314) systems registered and eligible to create SRECs in the PJM Generation Attribute Tracking System (GATS) registry. Of these eligible systems, 70 (0.40%) have a nameplate capacity of 1 megawatt or greater, of which only 4 systems are greater than 5 MW. The largest system, currently located in New Jersey, is 18.3 MW, and the second largest, located in Ohio is 12 MW. The third largest system, at 10 MW, is located in IL and eligible for the MD, PA, and DC SREC markets. The fourth largest, at 6.2 MW, is located in New Jersey.

New Energy Year To Begin for DE, NJ, and PA

June 1, 2011 marks the beginning of the new energy year for DE, NJ, and PA. All requirements for these markets increase given their RPS solar carve out schedules. SRECs for the month of June, the first creation period for the new reporting year, will be minted at the end of July.

Delaware: The reporting year 2011-2012 requirement for DE equates to approximately 21 MW being online for the entire year or approximately 25,600 SRECs created. As of July 25, 2011, 9.1 MW of solar capacity was registered and eligible to create DE SRECs in PJM GATS.

New Jersey: The reporting year 2012 requirement for NJ equates to approximately 368 MW being online for the entire year with a fixed SREC requirement of 442,000 MWhs. As of July 25, 2011, 347.5 MW of solar capacity was registered and eligible to create NJ SRECs in PJM GATS. While this figure represents all projects registered in GATS, there are recently installed projects awaiting issuance of a New Jersey state certification number. This delay results in a portion of installed projects not yet represented in the 347.5 MW figure. On July 26, 2011 the NJ Office of Clean Energy (NJ OCE) reported that as of June 30, 2011 more than 380 MW (10,086 projects) of solar had been installed in NJ. The news release noted that 40 MW were installed in the month of June.

Pennsylvania: The reporting year 2012 requirement for PA equates to approximately 44 MW being online for the entire year or approximately 53,000 SRECs created. As of July 25, 2011, 115.7 MW of solar capacity was registered and eligible to create PA SRECs in PJM GATS.

Massachusetts DOER Qualified Projects

As of July 11, 2011, there were 682 MA DOER qualified solar projects; 649 operational and 33 not operational. Of these qualified systems, 11 (1.6%) have a nameplate capacity of 1 megawatt or greater, of which only 3 are between 1.5 and 2 MW. Three of the projects greater than 1 MW are currently operational.

Capacity Summary By State

The tables above demonstrate the capacity breakout by state. Note, that for all PJM GATS registered projects, each state includes all projects certified to sell into that state. State RPS programs that allow for systems sited in other states to participate have been broken up by systems sited in state and out of state. Additional detail has been provided to demonstrate the total capacity of systems only certified for one specific state market versus being certified for multiple state markets. For example, PA includes projects only certified to sell into the PA SREC market, broken out by in state and out of state systems, as well as projects that are also certified to sell into PA and Other State markets broken out by in state and out of state systems (i.e. OH, DC, MD, DE, NJ). PA Out of State includes systems sited in states with their own state SREC market (i.e. DE) as well as systems sited in states that have no SREC market (i.e. VA). Also, it is important to note that the Current Capacity represents the total megawatts eligible to produce and sell SRECs as of the noted date, while the Estimated Required Capacity – Current and Next Reporting Year represents the estimated number of MW that need to be online on average throughout the reporting period to meet the RPS requirement within each state. For example, New Jersey needs approximately 368 MW online for the entire 2012 reporting year to meet the RPS requirement. Additionally, the data presented above does not include projects that are in the pipeline or currently going through the registration process in each state program. This data represents specifically the projects that have been approved for the corresponding state SREC markets as of the dates noted.

Solar Capacity in the SREC States – June 2011

Posted July 5th, 2011 by SRECTrade.

SRECTrade SREC Markets Report: June 2011

The following post outlines the megawatts of solar capacity certified and/or registered to create SRECs in the SREC markets SRECTrade currently serves.

For a PDF copy of this table click here.

Capacity_June2011_1

PJM Eligible Systems

As of the end of June, there were 16,381 solar PV (16,069) and solar thermal (312) systems registered and eligible to create SRECs in the PJM Generation Attribute Tracking System (GATS) registry. Of these eligible systems, 65 (0.40%) have a nameplate capacity of 1 megawatt or greater, of which only 4 systems are greater than 5 MW. The largest system, currently located in New Jersey, is 18.3 MW,  and the second largest, located in Ohio is 12 MW. The third largest system, at 10 MW, is located in IL and eligible for the MD, PA, and DC SREC markets. The fourth largest, at 6.2 MW, is located in New Jersey.

New Energy Year To Begin for DE, NJ, and PA

June 1, 2011 marks the beginning of the new energy year for DE, NJ, and PA. All requirements for these markets increase given their RPS solar carve out schedules. SRECs for the month of June, the first creation period for the new reporting year, will be minted at the end of July.

Delaware: The reporting year 2011-2012 requirement for DE equates to approximately 21 MW being online for the entire year or approximately 25,600 SRECs created. As of June 30, 2011, 9.1 MW of solar capacity was registered and eligible to create DE SRECs in PJM GATS.

New Jersey: The reporting year 2012 requirement for NJ equates to approximately 368 MW being online for the entire year with a fixed SREC requirement of 442,000 MWhs. As of June 30, 2011, 332 MW of solar capacity was registered and eligible to create NJ SRECs in PJM GATS. As of April 30, 2011, the NJ Office of Clean Energy (NJOCE) reported that 330.5 MW (9,181 projects) of solar had been installed in the state. The NJOCE data shows that from November 2010 – April 2011, the average installed capacity per month was 18 MW. Forecasts prepared by the NJOCE, show the monthly rate of installation through September 2011 ranging between 17 – 30 MW per month depending on different scenarios.

Pennsylvania: The reporting year 2012 requirement for PA equates to approximately 44 MW being online for the entire year or approximately 53,000 SRECs created. As of June 30, 2011, 104.8 MW of solar capacity was registered and eligible to create PA SRECs in PJM GATS.

Massachusetts DOER Qualified Projects

As of May 6, 2011, there were 524 MA DOER qualified solar projects; 467 operational and 57 not operational. Of these qualified systems, 11 (2.1%) have a nameplate capacity of 1 megawatt or greater, of which only 3 are between 1.5 and 2 MW. Three of the projects greater than 1 MW are currently operational.

Capacity Summary By State

The tables above demonstrate the capacity breakout by state. Note, that for all PJM GATS registered projects, each state includes all projects certified to sell into that state. State RPS programs that allow for systems sited in other states to participate have been broken up by systems sited in state and out of state. Additional detail has been provided to demonstrate the total capacity of systems only certified for one specific state market versus being certified for multiple state markets. For example, PA includes projects only certified to sell into the PA SREC market, broken out by in state and out of state systems, as well as projects that are also certified to sell into PA and Other State markets broken out by in state and out of state systems (i.e. OH, DC, MD, DE, NJ). PA Out of State includes systems sited in states with their own state SREC market (i.e. DE) as well as systems sited in states that have no SREC market (i.e. VA). Also, it is important to note that the Current Capacity represents the total megawatts eligible to produce and sell SRECs as of the noted date, while the Estimated Required Capacity – Current and Next Reporting Year represents the estimated number of MW that need to be online on average throughout the reporting period to meet the RPS requirement within each state. For example, New Jersey needs approximately 255 MW online for the entire 2011 reporting year to meet the RPS requirement. Additionally, the data presented above does not include projects that are in the pipeline or currently going through the registration process in each state program. This data represents specifically the projects that have been approved for the corresponding state SREC markets as of the dates noted.

DC SREC Market Amendment – Update

Posted June 15th, 2011 by SRECTrade.

On June 7, 2011, the Council of the District of Columbia read and reviewed the latest draft of Bill 19-10, also known as the Distributed Generation Amendment Act of 2011.  For the details of the pending amendment please click here. The amendment received a substantial support from the local legislators as well as the DC solar community. The final vote after the first reading was 14-0, unanimously in favor of putting the amendment into effect.

As it currently stands, below are the key points of the amendment under consideration:

– Solar thermal system eligibility to participate in the SREC market. For more info see this post.

– Implementation of new solar capacity requirements and a new solar alternative compliance payment (SACP) schedule:

Year Current RPS Solar Requirement Proposed RPS Solar Requirement Jan-11 Proposed RPS Solar Requirement June-11 Current SACP Proposed SACP June-11
2011 0.04% 0.25% 0.40% $500 $500
2012 0.07% 0.50% 0.50% $500 $500
2013 0.10% 0.75% 0.50% $500 $500
2014 0.13% 1.00% 0.60% $500 $500
2015 0.17% 1.25% 0.70% $500 $500
2016 0.21% 1.50% 0.825% $500 $500
2017 0.25% 1.75% 0.98% $500 $350
2018 0.30% 2.00% 1.15% $500 $300
2019 0.35% 2.25% 1.35% $500 $200
2020 0.40% 2.50% 1.58% $500 $200
2021 1.85% $150
2022 2.175% $150
2023 2.50% $50

The amendment puts it place a system size cap, stating that all solar requirements be met by acquiring SRECs from systems no larger than 5 MW. Additionally, the amendment requires systems to be sited within the District. For systems located outside of the District, the amendment plans to grandfather systems smaller than 5 MW in capacity that were registered as a renewable resource with the District prior to January 31, 2011.

As mentioned in our previous blog post on this potential change to the District’s existing RPS law, this bill will take very important, concrete steps to addressing the current oversupply in the DC market.

It is still unclear how the grandfather date of 1/31/2011 will affect facilities outside the district that have been registered by the DC Public Services Commission and issued SRECs since then.

As the District is still operating under the current RPS law, out-of-state systems are still eligible to be certified for SREC generation, but it is unknown if the registration will hold value considering the implications of the amendment. The DC Council website does not currently indicate the next date for further consideration, but SRECTrade will continue to provide additional information as it becomes available.

Solar Capacity in the SREC States – May 2011

Posted June 1st, 2011 by SRECTrade.

SRECTrade SREC Markets Report: May 2011

The following post outlines the megawatts of solar capacity certified and/or registered to create SRECs in the SREC markets SRECTrade currently serves.

May 2011 Updated JPEG

PJM Eligible Systems

As of the end of May, there were 15,480 solar PV (15,203) and solar thermal (277) systems registered and eligible to create SRECs in the PJM Generation Attribute Tracking System (GATS) registry. Of these eligible systems, 59 (0.38%) have a nameplate capacity of 1 megawatt or greater, of which only 3 systems are greater than 5 MW. The largest system, currently located in New Jersey, is 18.3 MW,  and the second largest, located in Ohio is 12 MW. The third largest system, is located in IL and eligible for the MD, PA, and DC SREC markets, is 10 MW.

Massachusetts DOER Qualified Projects

As of May 6, 2011, there were 524 MA DOER qualified solar projects; 467 operational and 57 not operational. Of these qualified systems, 11 (2.1%) have a nameplate capacity of 1 megawatt or greater, of which only 3 are between 1.5 and 2 MW. Three of the projects greater than 1 MW are currently operational.

Capacity Summary By State

The tables above demonstrate the capacity breakout by state. Note, that for all PJM GATS registered projects, each state includes all projects certified to sell into that state. State RPS programs that allow for systems sited in other states to participate have been broken up by systems sited in state and out of state. Additional detail has been provided to demonstrate the total capacity of systems only certified for one specific state market versus being certified for multiple state markets. For example, PA includes projects only certified to sell into the PA SREC market, broken out by in state and out of state systems, as well as projects that are also certified to sell into PA and Other State markets broken out by in state and out of state systems (i.e. OH, DC, MD, DE, NJ). PA Out of State includes systems sited in states with their own state SREC market (i.e. DE) as well as systems sited in states that have no SREC market (i.e. VA). Also, it is important to note that the Current Capacity represents the total megawatts eligible to produce and sell SRECs as of the noted date, while the Estimated Required Capacity – Current and Next Reporting Year represents the estimated number of MW that need to be online on average throughout the reporting period to meet the RPS requirement within each state. For example, New Jersey needs approximately 255 MW online for the entire 2011 reporting year to meet the RPS requirement. Additionally, the data presented above does not include projects that are in the pipeline or currently going through the registration process in each state program. This data represents specifically the projects that have been approved for the corresponding state SREC markets as of the dates noted.

Subscribe

Solar Capacity in the SREC States – April 2011

Posted May 4th, 2011 by SRECTrade.

SRECTrade SREC Markets Report: April 2011

The following post outlines the megawatts of solar capacity certified and/or registered to create SRECs in the SREC markets SRECTrade currently serves.

GATS_MA_Generators_April_2011_v1

PJM Eligible Systems

As of the end of April, there were 14,598 solar PV (14,344) and solar thermal (254) systems registered and eligible to create SRECs in the PJM Generation Attribute Tracking System (GATS) registry. Of these eligible systems, 52 (0.36%) have a nameplate capacity of 1 megawatt or greater, of which only 3 systems are greater than 5 MW. The largest system, currently located in Ohio, is 12 MW,  and the second largest, located in Chicago and eligible for the PA, DC, and MD markets, is 10 MW. The third largest system, located in NJ, is 5.6 MW.

Massachusetts DOER Qualified Projects

As of April 13, 2011, there were 524 MA DOER qualified solar projects; 467 operational and 57 not operational. Of these qualified systems, 11 (2.1%) have a nameplate capacity of 1 megawatt or greater, of which only 3 are between 1.5 and 2 MW. Three of the projects greater than 1 MW are currently operational.

Capacity Summary By State

The tables above demonstrate the capacity breakout by state. Note, that for all PJM GATS registered projects, each state includes all projects certified to sell into that state. State RPS programs that allow for systems sited in other states to participate have been broken up by systems sited in state and out of state. Additional detail has been provided to demonstrate the total capacity of systems only certified for one specific state market versus being certified for multiple state markets. For example, PA includes projects only certified to sell into the PA SREC market, broken out by in state and out of state systems, as well as projects that are also certified to sell into PA and Other State markets broken out by in state and out of state systems (i.e. OH, DC, MD, DE, NJ). PA Out of State includes systems sited in states with their own state SREC market (i.e. DE) as well as systems sited in states that have no SREC market (i.e. VA). Also, it is important to note that the Current Capacity represents the total megawatts eligible to produce and sell SRECs as of the noted date, while the Estimated Required Capacity – Current and Next Reporting Year represents the estimated number of MW that need to be online on average throughout the reporting period to meet the RPS requirement within each state. For example, New Jersey needs approximately 255 MW online for the entire 2011 reporting year to meet the RPS requirement. Additionally, the data presented above does not include projects that are in the pipeline or currently going through the registration process in each state program. This data represents specifically the projects that have been approved for the corresponding state SREC markets as of the dates noted.

Subscribe


Solar Capacity in the SREC States – March 2011

Posted April 4th, 2011 by SRECTrade.

SRECTrade SREC Markets Report: March 2011

The following post outlines the megawatts of solar capacity certified and/or registered to create SRECs in the SREC markets SRECTrade currently serves.

Summary JPEG

PJM Eligible Systems

As of the end of March, there were 13,888 solar PV (13,634) and solar thermal (254) systems registered and eligible to create SRECs in the PJM Generation Attribute Tracking System (GATS) registry. Of these eligible systems, 46 (0.33%) have a nameplate capacity of 1 megawatt or greater, of which only 3 systems are greater than 5 MW. The largest system, currently located in Ohio, is 12 MW,  and the second largest, located in Chicago and eligible for the PA, DC, and MD markets, is 10 MW. The third largest system, located in NJ, is 5.6 MW.

Massachusetts DOER Qualified Projects

As of March 16, 2011, there were 337 MA DOER qualified solar projects; 314 operational and 23 not operational. Of these qualified systems, 11 (3.3%) have a nameplate capacity of 1 megawatt or greater, of which only 3 are between 1.5 and 2 MW. Two of the projects greater than 1 MW are currently operational.

Capacity Summary By State

The tables above demonstrate the capacity breakout by state. Note, that for all PJM GATS registered projects, each state includes all projects certified to sell into that state. State RPS programs that allow for systems sited in other states to participate have been broken up by systems sited in state and out of state. Additional detail has been provided to demonstrate the total capacity of systems only certified for one specific state market versus being certified for multiple state markets. For example, PA includes projects only certified to sell into the PA SREC market, broken out by in state and out of state systems, as well as projects that are also certified to sell into PA and Other State markets broken out by in state and out of state systems (i.e. OH, DC, MD, DE, NJ). PA Out of State includes systems sited in states with their own state SREC market (i.e. DE) as well as systems sited in states that have no SREC market (i.e. VA). Also, it is important to note that the Current Capacity represents the total megawatts eligible to produce and sell SRECs as of the noted date, while the Estimated Required Capacity – Current and Next Reporting Year represents the estimated number of MW that need to be online on average throughout the reporting period to meet the RPS requirement within each state. For example, New Jersey needs approximately 255 MW online for the entire 2011 reporting year to meet the RPS requirement. Additionally, the data presented above does not include projects that are in the pipeline or currently going through the registration process in each state program. This data represents specifically the projects that have been approved for the corresponding state SREC markets as of the dates noted.

Subscribe


Solar Capacity in the SREC States – February 2011

Posted March 2nd, 2011 by SRECTrade.

SRECTrade SREC Markets Report: February 2011

The following post outlines the megawatts of solar capacity certified and/or registered to create SRECs in the SREC markets SRECTrade currently serves.

Blog Table Image JPG more pixels

PJM Eligible Systems

As of the end of February, there were 12,995 solar PV (12,747) and solar thermal (248) systems registered and eligible to create SRECs in the PJM Generation Attribute Tracking System registry. Of these eligible systems, 43 (0.33%) have a nameplate capacity of 1 megawatt or greater, of which only 3 systems are greater than 5 MW. The largest system, currently located in Ohio, is 12 MW,  and the second largest, located in Chicago and eligible for the PA, DC, and MD markets, is 10 MW. The third largest system, located in NJ, is 5.6 MW.

Massachusetts DOER Qualified Projects

As of February 18, 2011, there were 220 MA DOER qualified solar projects; 204 operational and 16 not operational. Of these qualified systems, 10 (4.5%) have a nameplate capacity of 1 megawatt or greater, of which only 3 are between 1.5 and 2 MW. Only one of the projects greater than 1 MW is currently operational.

Capacity Summary By State

The tables above demonstrate the capacity breakout by state. Note, that for all PJM GATS registered projects, each state includes all projects certified to sell into that state. State RPS programs that allow for systems sited in other states to participate have been broken up by systems sited in state and out of state. Additional detail has been provided to demonstrate the total capacity of systems only certified for one specific state market versus being certified for multiple state markets. For example, PA includes projects only certified to sell into the PA SREC market, broken out by in state and out of state systems, as well as projects that are also certified to sell into PA and Other State markets broken out by in state and out of state systems (i.e. OH, DC, MD, DE, NJ). PA Out of State includes systems sited in states with their own state SREC market (i.e. DE) as well as systems sited in states that have no SREC market (i.e. VA). Also, it is important to note that the Current Capacity represents the total megawatts eligible to produce and sell SRECs as of the noted date, while the Estimated Required Capacity – Current and Next Reporting Year represents the estimated number of MW that need to be online on average throughout the reporting period to meet the RPS requirement within each state. For example, New Jersey needs approximately 255 MW online for the entire 2011 reporting year to meet the RPS requirement. Additionally, the data presented above does not include projects that are in the pipeline or currently going through the registration process in each state program. This data represents specifically the projects that have been approved for the corresponding state SREC markets as of the date noted.

Subscribe


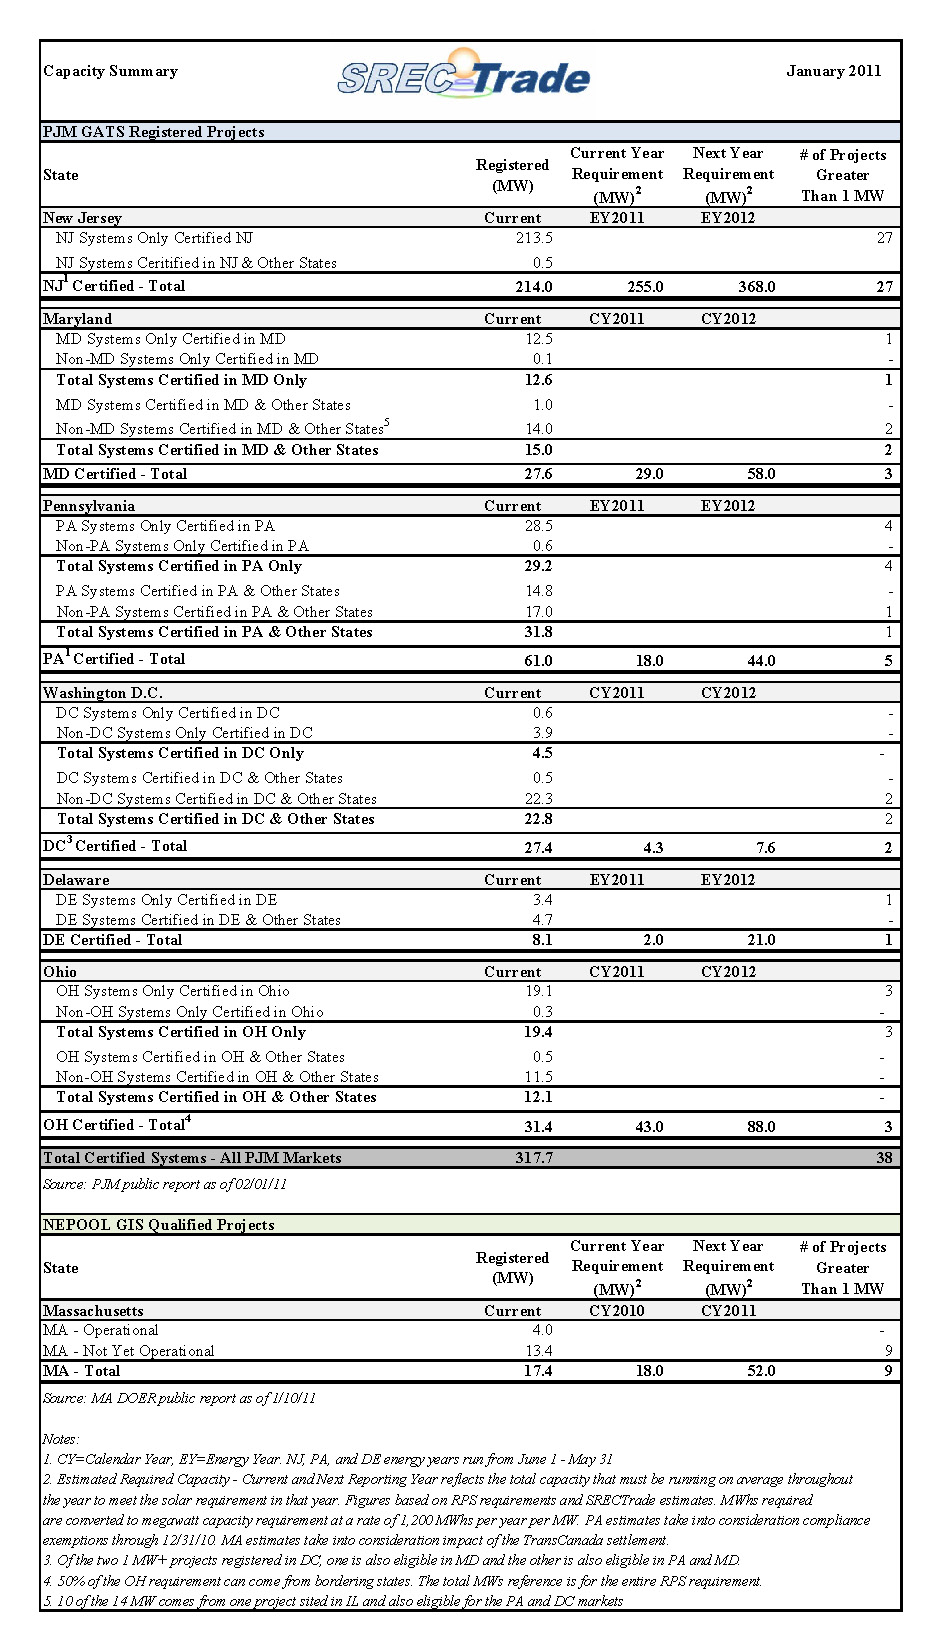
Solar Capacity in the SREC States – January 2011

Posted February 2nd, 2011 by SRECTrade.

SRECTrade SREC Markets Report: January 2011

The following post outlines the megawatts of solar capacity certified and/or registered to create SRECs in the SREC markets SRECTrade currently serves.

SREC Supply January 2011

PJM Eligible Systems

As of the end of January, there were 12,240 solar PV (12,001) and solar thermal (239) systems registered and eligible to create SRECs in the PJM Generation Attribute Tracking System registry. Of these eligible systems, 38 (0.3%) have a nameplate capacity of 1 megawatt or greater, of which only 3 systems are greater than 5 MW. The largest system, currently located in Ohio, is 12 MW,  and the second largest, located in Chicago and eligible for the PA, DC, and MD markets, is 10 MW. The third largest system, located in NJ, is 5.6 MW.

Massachusetts DOER Qualified Projects

As of January 10, 2011, there were 206 MA DOER qualified solar projects; 183 operational and 23 not operational. Of these qualified systems, 9 (4.4%) have a nameplate capacity of 1 megawatt or greater, of which only 2 are between 1.5 and 2 MW. None of the projects greater than 1 MW are currently operational.

Capacity Summary By State

The tables above demonstrate the capacity breakout by state. Note, that for all PJM GATS registered projects, each state includes all projects certified to sell into that state. State RPS programs that allow for systems sited in other states to participate have been broken up by systems sited in state and out of state. Additional detail has been provided to demonstrate the total capacity of systems only certified for one specific state market versus being certified for multiple state markets. For example, PA includes projects only certified to sell into the PA SREC market, broken out by in state and out of state systems, as well as projects that are also certified to sell into PA and Other State markets broken out by in state and out of state systems (i.e. OH, DC, MD, DE, NJ). PA Out of State includes systems sited in states with their own state SREC market (i.e. DE) as well as systems sited in states that have no SREC market (i.e. VA). Also, it is important to note that the Current Capacity represents the total megawatts eligible to produce and sell SRECs as of the noted date, while the Estimated Required Capacity – Current and Next Reporting Year represents the estimated number of MW that need to be online on average throughout the reporting period to meet the RPS requirement within each state. For example, New Jersey needs approximately 255 MW online for the entire 2011 reporting year to meet the RPS requirement. Additionally, the data presented above does not include projects that are in the pipeline or currently going through the registration process in each state program. This data represents specifically the projects that have been approved for the corresponding state SREC markets as of the date noted.

Subscribe


Why other states should take note of the Massachusetts SREC program

Posted November 8th, 2010 by SRECTrade.

On the heels of the Conference On Clean Energy in Boston last week, it is worth drawing attention to the Massachusetts SREC program. Though the market is still in the very early stages of development, the program has been well-conceived and one that may serve to be a template for future SREC markets. (And yes, SREC markets are coming!)

Solar is nothing new to Massachusetts, but SRECs were only introduced in 2010. Prior to the solar carve-out, solar owners had to rely on large upfront incentives and the sale of Class I RECs that had limited value.  The solar carve-out set the stage for an SREC program that will provide a market-based incentive to help subsidize the cost of solar today. Though any homeowner or investor would prefer an upfront cash grant from the state for their solar system, the reality is that both society and the industry have suffered from a reliance on these programs that are at the same time costly and incredibly volatile in availability. The beauty of the SREC program is that it creates a market-based subsidy that is not paid out by the state government, but by the electricity companies that supply the state. Though the price paid for SRECs may vary, the payments made to solar owners for SREC sales can be viewed as a tax levied on the suppliers of dirty energy. As such, once implemented, the program does not require the additional allocation of state funding to subsidize projects. As solar proliferates in the state, the market-based SREC price will come down over time. Meanwhile, solar businesses that adapt to the SREC program will find comfort in the continuity it provides, especially after years of boom and bust periods driven by upfront subsidies.

This fluctuating SREC price is at the heart of the greatest challenge that participants in the solar industry face when confronted with an SREC market. Addressing this uncertainty is precisely why Massachusetts stands out from any other SREC market in the U.S.  Instead of setting fixed long-term targets that may or may not be achieved, Massachusetts has set up a formula that publishes a new target each year based on the conditions in the market the previous year. This formula is designed to ensure that the state is setting goals that are neither too aggressive nor too weak.  As a result, it should be easier for developers to finance solar projects based on the price of SRECs.

This is very different from what we’ve seen in other states. In New Jersey, the state goals increased so aggressively that the market could not keep up and SREC values remained high. This isn’t entirely a bad thing for New Jersey since the state earned ~$700 for each SREC that electricity companies fell short last year. Though that money was intended to fund clean energy projects, Republican Governor Christie was able to use it to balance the state budget. Although the next few examples highlight the opposite extreme, the shortfall in New Jersey in 2010 could very easily happen to any of the other SREC states 5 years from now. At about 255 MW required this year, New Jersey dwarfs every other state that followed in implementing a program.

In the smaller state markets, the problem in the early years is the disproportionate impact that a large project could have on a single market. In 2009 the Delaware market was threatened by a 14 MW Delmarva project that would have collapsed state SREC pricing if it weren’t for state intervention.  Meanwhile, in the next few years, the announcement by AEP of a 50 MW project in Ohio could place a significant burden on the in-state solar industry that only has about a 45 MW requirement for 2011. New Jersey was able to protect the SREC program in the early years by placing a 2MW maximum on qualification. It lifted that restriction in 2010 to feed the exponential growth needed to meet the RPS solar requirement. Hopefully Ohio, Pennsylvania and the other budding state SREC markets realize the impact these large projects will have on a solar industry that is just learning to thrive off of SRECs.

Meanwhile, back in Massachusetts, it seems the state has already thought through a lot of these issues. The aforementioned formula for determining the requirement each year provides certainty that an influx of large projects won’t collapse SREC pricing for everyone else.  In addition, though it recently raised the cap on system sizes from 2 MW to 6 MW, the cap should be enough to ensure that an industry is built, not a few large solar farms. Finally, in case the flexible requirement and 6 MW cap weren’t enough to help participants feel comfortable, the state implemented a program with a floor price of $300 per SREC.  As a result, SRECs in Massachusetts will trade between $300 and $600.  In the unlikely event that there is an oversupply, the state will host a fixed-price auction that will give buyers a chance to purchase the SRECs at $300 to get an early start on the next year. If the SRECs don’t sell after a couple rounds, the state will put them back into the market with an extended life, while at the same time, increasing the requirements proportionally.

In summary, if all goes as planned with the Massachusetts solar carve-out, the state requirement should increase enough each year so that there is never an oversupply.  In the event that there is an oversupply, the state will host an auction for buyers at $300.  If any SRECs go through the auction unsold, the state will increase the requirements to make sure that buyers will be willing to pay more than $300 for them.  For someone looking for certainty in SREC prices, a gaping oversupply will be very unlikely, an unsuccessful last-chance auction will be extremely rare, and if both those scenarios exist, the possibility that a buyer is not willing to pay at least $300 per SREC is unimaginable under the rules put forth by the state of Massachusetts.

Hopefully all the other SREC states, current and future, take note of the Massachusetts Solar Carve-Out.

Subscribe

Solar Capacity in the SREC States in 2010

Posted July 28th, 2010 by SRECTrade.

SRECTrade’s State of the SREC Markets in 2010
The New Jersey, Pennsylvania and Delaware Energy Years came to a close on May 31, 2010.  The following is a report of the solar capacity in megawatts (MW) certified and registered to create SRECs in all states at that time.

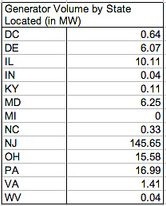
Solar generators by state located: This table is based solely on the location of the facility and does not include multiple state listings. All facilities must have been registered by May 31st, 2010.

As you can see New Jersey has by far the largest amount of solar installed and eligible for SRECs with 146 MW. Pennsylvania is a distant second at 17 MW.  Meanwhile, Ohio and Illinois are third and fourth respectively, however of the 16 MW in Ohio, 12 come from one facility and of the 10.1 MW in Illinois, 10 come from one facility. Delaware and Maryland both have sizable markets at around 6 MW each. Volumes in other state are much smaller since there is no local SREC market.

Solar generators by size: Projects certified for SREC markets range in size from as small as 0.5 kW to as large as 12 MW, however, only 20 out of the 7,700 projects are over 1 MW.  Of those 20 projects all are well below 5 MW, with the exception of a 10 MW facility in Illinois and 12 MW facility in Ohio. The lack of multi-MW facilities in the SREC markets is a function of both the complexity involved and constraints on demand. The only state SREC market today with any legitimate appetite for multi-MW facilities is New Jersey.

Solar generators by state eligibility: Because some states accept out-of-state SRECs, the in-state supply listed above differs from the total supply available to buyers in that state.  For instance, Ohio’s market also includes facilities located in PA, WV, KY, IN, and MI.  The table below lists the total solar capacity in megawatts eligible for each SREC market, along with the percent of the market that is sourced in-state.  Note: many facilities will be counted multiple times in this table since they are eligible in several states. For example, the 10 MW facility in Illinois is eligible in both DC and PA.

In Ohio 89.6% of the market is in-state SRECs. Some of our customers have asked why in-state Ohio SRECs do not sell at a premium because of the 50% in-state requirement. The reason is that, as you can see, buyers are not having difficulty meeting the 50% requirement with the large supply of in-state SRECs. In the future as the requirements increase, in-state SRECs could be harder to come by and may indeed sell for more than out-of-state SRECs.

Interpreting the data: One important thing to notice is that the 2010 Capacity Requirement column details the capacity required to be sustained throughout the entire energy year. The Volume column shows the capacity registered through May 2010. For example, New Jersey needed approximately 160 MW of capacity running on average from June 2009 through May 2010 in order to meet the 2010 SREC requirement. The state is actually farther away from the 160 MW capacity mark than the 145.69 MW volume would suggest.  Capacity in New Jersey grew approximately 65 MW over the course of the year and so there were probably only enough SRECs created to meet approximately 110-115 MW of the 160 MW requirement. That requirement increases in the 2011 Energy Year to approximately 260 MW. For more information on the growth of the New Jersey market and any other state market, please visit our page devoted to State SREC Markets.

Assumptions used in calculations: Solar capacity required is based on 2007 Department of Energy electricity sales figures, assuming a 1.5% growth rate. The resulting solar megawatt-hours required (i.e. SRECs) are converted to megawatt capacity requirement at a rate of 1200 MWhs per MW.