SRECTrade’s State of the SREC Markets in 2010
The New Jersey, Pennsylvania and Delaware Energy Years came to a close on May 31, 2010. The following is a report of the solar capacity in megawatts (MW) certified and registered to create SRECs in all states at that time.
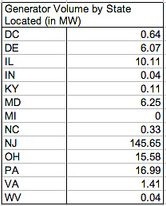
Solar generators by state located: This table is based solely on the location of the facility and does not include multiple state listings. All facilities must have been registered by May 31st, 2010.

As you can see New Jersey has by far the largest amount of solar installed and eligible for SRECs with 146 MW. Pennsylvania is a distant second at 17 MW. Meanwhile, Ohio and Illinois are third and fourth respectively, however of the 16 MW in Ohio, 12 come from one facility and of the 10.1 MW in Illinois, 10 come from one facility. Delaware and Maryland both have sizable markets at around 6 MW each. Volumes in other state are much smaller since there is no local SREC market.
Solar generators by size: Projects certified for SREC markets range in size from as small as 0.5 kW to as large as 12 MW, however, only 20 out of the 7,700 projects are over 1 MW. Of those 20 projects all are well below 5 MW, with the exception of a 10 MW facility in Illinois and 12 MW facility in Ohio. The lack of multi-MW facilities in the SREC markets is a function of both the complexity involved and constraints on demand. The only state SREC market today with any legitimate appetite for multi-MW facilities is New Jersey.
Solar generators by state eligibility: Because some states accept out-of-state SRECs, the in-state supply listed above differs from the total supply available to buyers in that state. For instance, Ohio’s market also includes facilities located in PA, WV, KY, IN, and MI. The table below lists the total solar capacity in megawatts eligible for each SREC market, along with the percent of the market that is sourced in-state. Note: many facilities will be counted multiple times in this table since they are eligible in several states. For example, the 10 MW facility in Illinois is eligible in both DC and PA.

In Ohio 89.6% of the market is in-state SRECs. Some of our customers have asked why in-state Ohio SRECs do not sell at a premium because of the 50% in-state requirement. The reason is that, as you can see, buyers are not having difficulty meeting the 50% requirement with the large supply of in-state SRECs. In the future as the requirements increase, in-state SRECs could be harder to come by and may indeed sell for more than out-of-state SRECs.
Interpreting the data: One important thing to notice is that the 2010 Capacity Requirement column details the capacity required to be sustained throughout the entire energy year. The Volume column shows the capacity registered through May 2010. For example, New Jersey needed approximately 160 MW of capacity running on average from June 2009 through May 2010 in order to meet the 2010 SREC requirement. The state is actually farther away from the 160 MW capacity mark than the 145.69 MW volume would suggest. Capacity in New Jersey grew approximately 65 MW over the course of the year and so there were probably only enough SRECs created to meet approximately 110-115 MW of the 160 MW requirement. That requirement increases in the 2011 Energy Year to approximately 260 MW. For more information on the growth of the New Jersey market and any other state market, please visit our page devoted to State SREC Markets.
Assumptions used in calculations: Solar capacity required is based on 2007 Department of Energy electricity sales figures, assuming a 1.5% growth rate. The resulting solar megawatt-hours required (i.e. SRECs) are converted to megawatt capacity requirement at a rate of 1200 MWhs per MW.


